Lucky Block (LBLOCK) Technical Outlook: Key Resistance Levels in Focus
Estimated Reading Time: 3 minutes
Don’t invest unless you’re prepared to lose all the money you invest. This is a high-risk investment and you are unlikely to be protected if something goes wrong. Take 2 minutes to learn more

Lucky Block (LBLOCK) Technical Analysis – July 31
Lucky Block (LBLOCK) has been gaining traction, with its price currently standing at $0.0000202. Over the past week, the cryptocurrency has appreciated by 5.75%, demonstrating its resilience and potential for growth.
Although it briefly reached a high of $0.0000213, it was unable to maintain this level. This analysis delves into LBLOCK’s performance using daily and 4-hour chart data to highlight key resistance and support levels.
Daily Chart Analysis of Lucky Block
On the daily chart, Lucky Block (LBLOCK) exhibits a promising upward trend with its current price at $0.0000202. The recent high of $0.0000213 signals a potential for further growth, despite the temporary resistance at that level. Over the past week, LBLOCK’s price increase of 5.75% highlights its resilience.
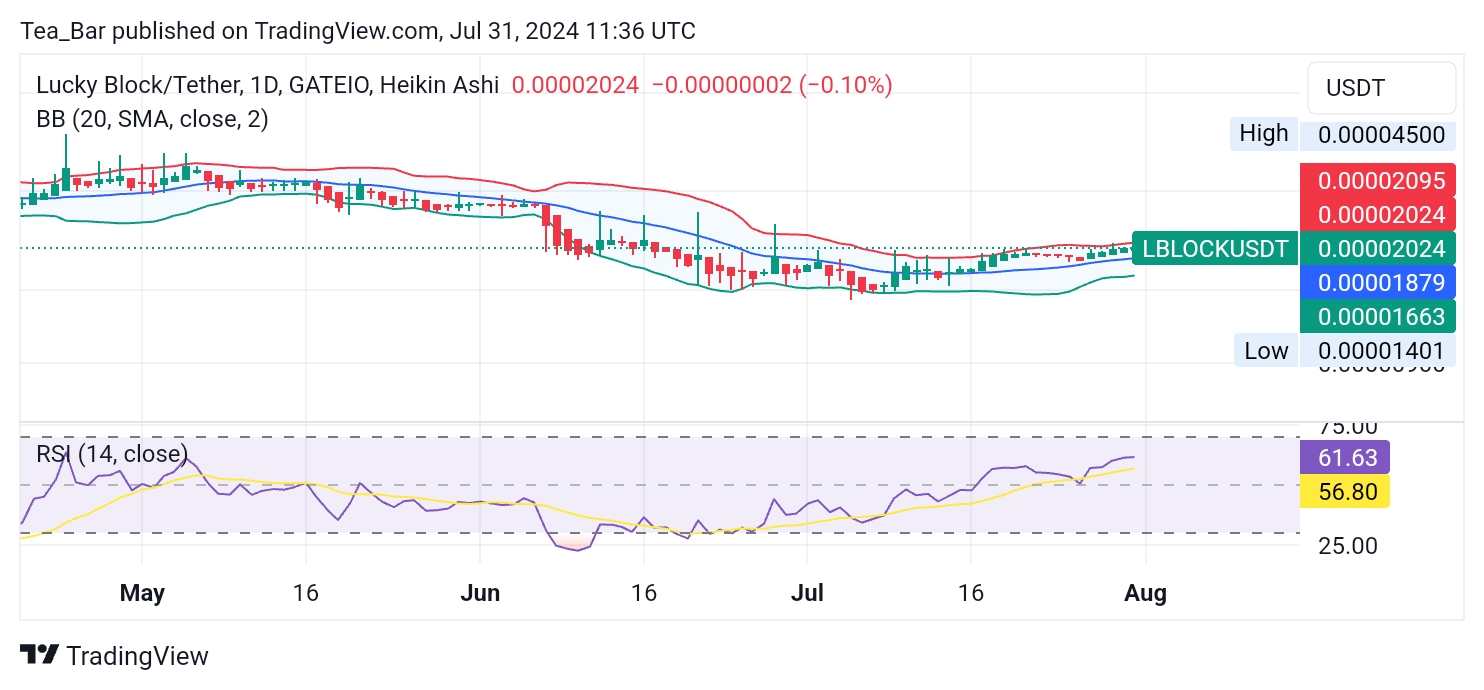
The Bollinger Bands on the daily chart show an upper band at $0.0000202, a middle band at $0.0000187, and a lower band at $0.0000166. The RSI (Relative Strength Index) for the past 14 days stands at 56, indicating a bullish sentiment among traders. The price positioning near the upper Bollinger Band suggests that LBLOCK is approaching key resistance, with solid support around the middle band of $0.0000187.
4-hour Chart Analysis
The 4-hour chart provides a detailed view of Lucky Block’s short-term performance. The Bollinger Bands indicate an upper band at $0.0000202, a middle band at $0.0000200, and a lower band at $0.0000193, suggesting a stable trading range with potential for upward movement. The RSI on the 4-hour chart is at 62, reflecting strong buying interest and a bullish sentiment.
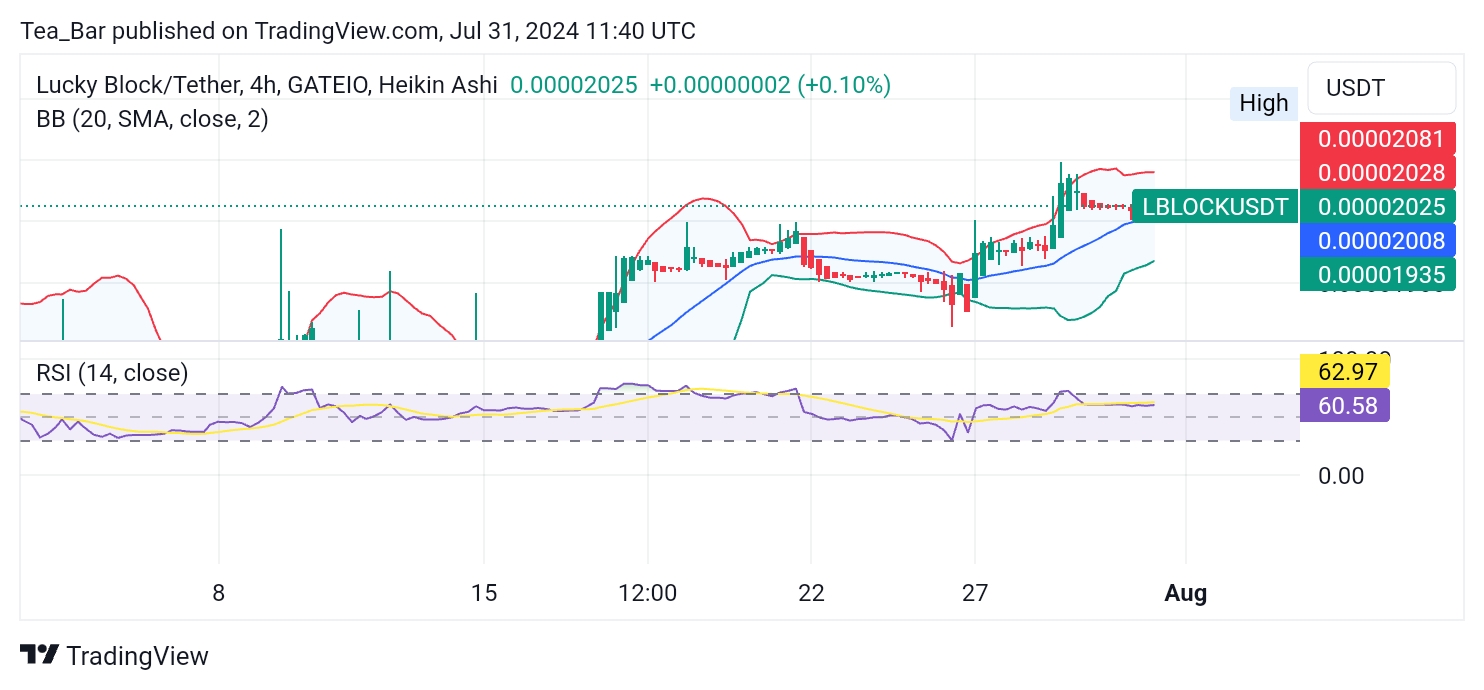
Given the current price is at the upper Bollinger Band, there is a notable resistance at $0.0000202. The tight Bollinger Bands indicate stability, with strong support expected around $0.0000200, providing a solid foundation for potential upward movement and cementing its place in the crypto world.
Conclusion
Lucky Block (LBLOCK) shows strong upward momentum with a 5.75% increase over the past week, currently priced at $0.0000202. The technical indicators from both the daily and 4-hour charts suggest potential for continued growth.
Key resistance levels to watch are $0.0000202 and $0.0000213. Support is likely around $0.0000200 and $0.0000187. Market participants should follow these resistance and support levels closely, as breaking through these barriers could signal a stronger bullish trend for LBLOCK.
You can purchase Lucky Block here. Buy LBLOCK.