Lucky Block (LBLOCK/USD) Market Shows Strong Bullish Signals Across Technical Indicators
Estimated Reading Time: 3 minutes
Don’t invest unless you’re prepared to lose all the money you invest. This is a high-risk investment and you are unlikely to be protected if something goes wrong. Take 2 minutes to learn more

Lucky Block Price Forecast – April 21
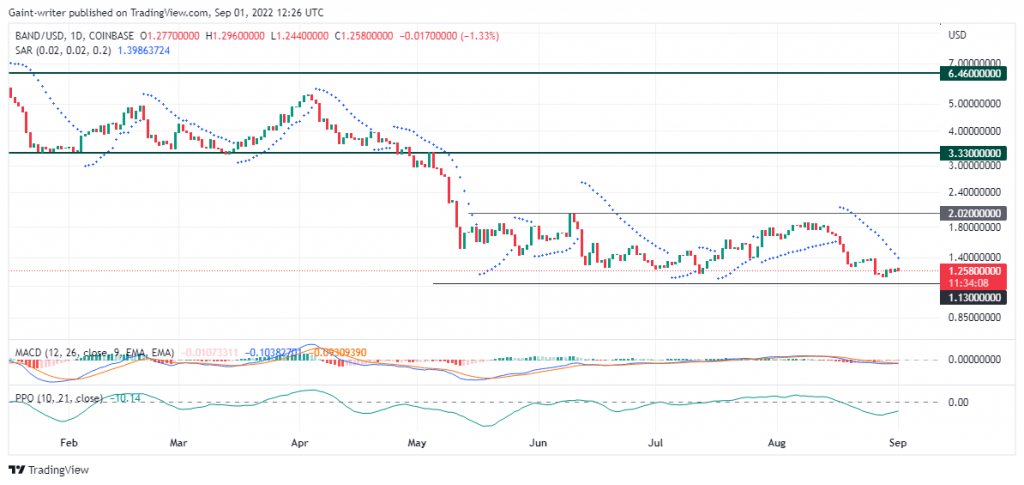
Lucky Block (LBLOCKUSD) market shows strong bullish signals across technical indicators. The MACD (Moving Average Convergence Divergence) recently crossed the zero line, indicating that the bulls are in control of the market.
The daily chart of LBLOCKUSD reveals bullish momentum supported by both the Moving Average and MACD indicators. The 9-day Simple Moving Average (SMA) is trending upward and currently sits around $0.00001290, acting as dynamic support for price. Meanwhile, the MACD lines have crossed bullishly below the zero line and continue to widen, with green histogram bars growing—suggesting increasing bullish strength and a potential continuation of the upward move.
LBLOCK/USD Market Key Levels:
Resistance levels: $0.00001400, $0.00001880, $0.00002490
Support levels: $0.00001000, $0.00000800, $0.00000600

LBLOCK/USD – Daily Chart
The daily chart of LBLOCKUSD reveals an impending breakout as price approaches double top.
Price action confirms this bullish sentiment with a solid rally from the recent low near $0.00000800, marked by a bullish reversal candle and a higher low. After reclaiming the $0.00001100 and $0.00001290 levels, price is now testing resistance at $0.00001400, which previously formed a double top. A clean break and retest of this level would reinforce a bullish market structure, confirming that buyers are gaining control.
What is the market outlook of LBLOCK/USD?
Looking forward, if LBLOCKUSD successfully breaks above $0.00001400, the next target lies at the $0.00001880 resistance zone. A pullback and higher low above $0.00001290 could provide a favorable re-entry for bulls aiming for this level. Beyond that, extended bullish pressure may drive price toward the $0.00002490 level, last seen during prior peaks, presenting a strong upside potential if volume and momentum persist.

LBLOCK/USD – Four-Hour Chart
LBLOCKUSD is trading above the rising trendline, confirming a bullish structure on the four-hour chart. Price is currently testing resistance at $0.00001360, just below the key level of $0.00001400 marked by a previous double top.
The 9-period SMA is sloping upward and acting as dynamic support, while the MACD remains in positive territory. A breakout above $0.00001400could trigger a rally toward higher levels, while $0.00001260 remains a critical support on pullbacks.
Lucky Block (LBLOCK) Current Statistics
The current price: $0.00001360
Market Capitalization: $1,040,000
Trading Volume: $65,850
Do you need a coin that will 100X soon? Get LBLOCK here