Movement (MOVE/USD): Is Bearish Momentum Losing Steam as Technical Indicators Hint at Reversal?
Estimated Reading Time: 3 minutes
Don’t invest unless you’re prepared to lose all the money you invest. This is a high-risk investment and you are unlikely to be protected if something goes wrong. Take 2 minutes to learn more
The downtrend in the Movement market appears to be slowing, as the price action encountered a strong reaction at the $0.15 support level. Bullish intervention at this zone has effectively halted the steep bearish momentum, introducing a phase of market indecision.
Although bearish sentiment remains present, the shift in price behavior—driven by renewed buying interest—suggests a potential turnaround may be forming. The price has now managed to break above the $0.15 threshold, showing early signs of recovery.
However, resistance pressure is intensifying around the $0.186 zone, where sellers are once again becoming more active. For a sustained bullish reversal to take hold, MOVE/USD must clear this level with conviction.
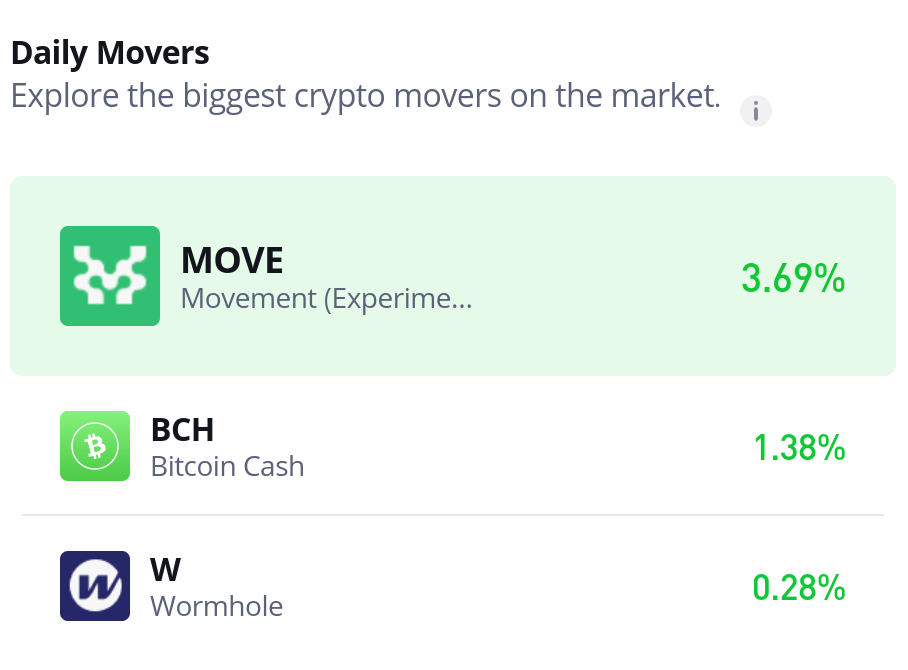
Movement Market Data
- MOVE/USD Price Now: $0.18
- MOVE/USD Market Cap: $61.8 million
- MOVE/USD Circulating Supply: 2.6 billion MOVE
- MOVE/USD Total Supply: 10 billion MOVE
- MOVE/USD CoinMarketCap Ranking: #113
Key Levels
- Resistance: $0.20, $0.30, and $0.40
- Support: $0.090, $0.080, and $0.070
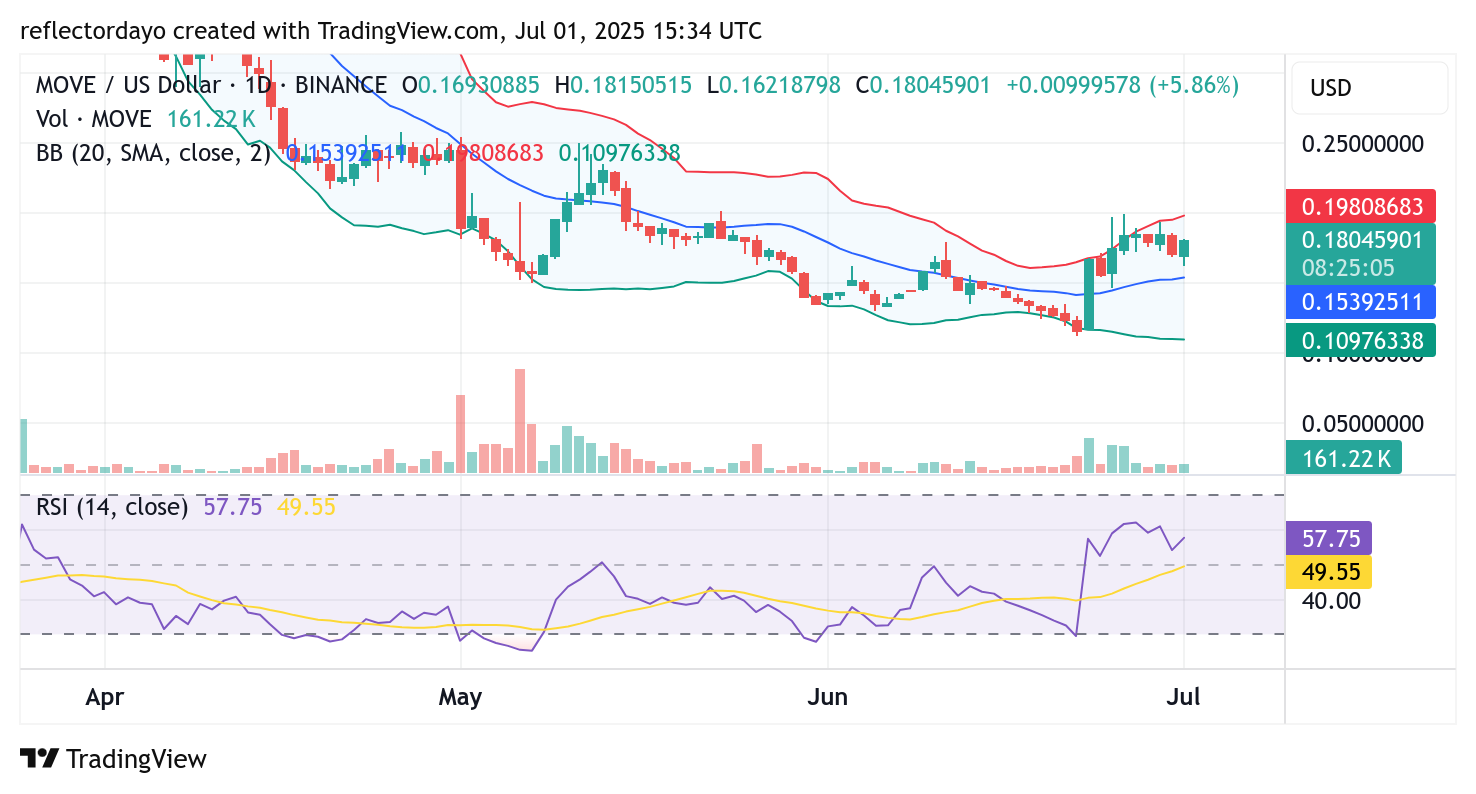
MOVE/USD Daily Chart Outlook: Bulls Hold $0.15 as Market Battles Resistance Near $0.19
In previous sessions, Movement saw a bullish push initiated at the $0.15 support level, which propelled the price upward. However, the rally stalled near the $0.17 mark before pulling back, reaffirming $0.15 as a key support zone.
More recently, the market climbed higher, reaching just below the $0.19 resistance level before facing another correction. The repeated rejection near this zone signals that bearish pressure remains active, even as bullish momentum attempts to build.
This tug-of-war between buyers and sellers has led to heightened volatility in the short term. Still, as long as bulls continue to defend the $0.15 support, the market structure remains intact, and the potential for a sustained breakout increases. A confirmed move above $0.19 could open the door for a more decisive upward trend.
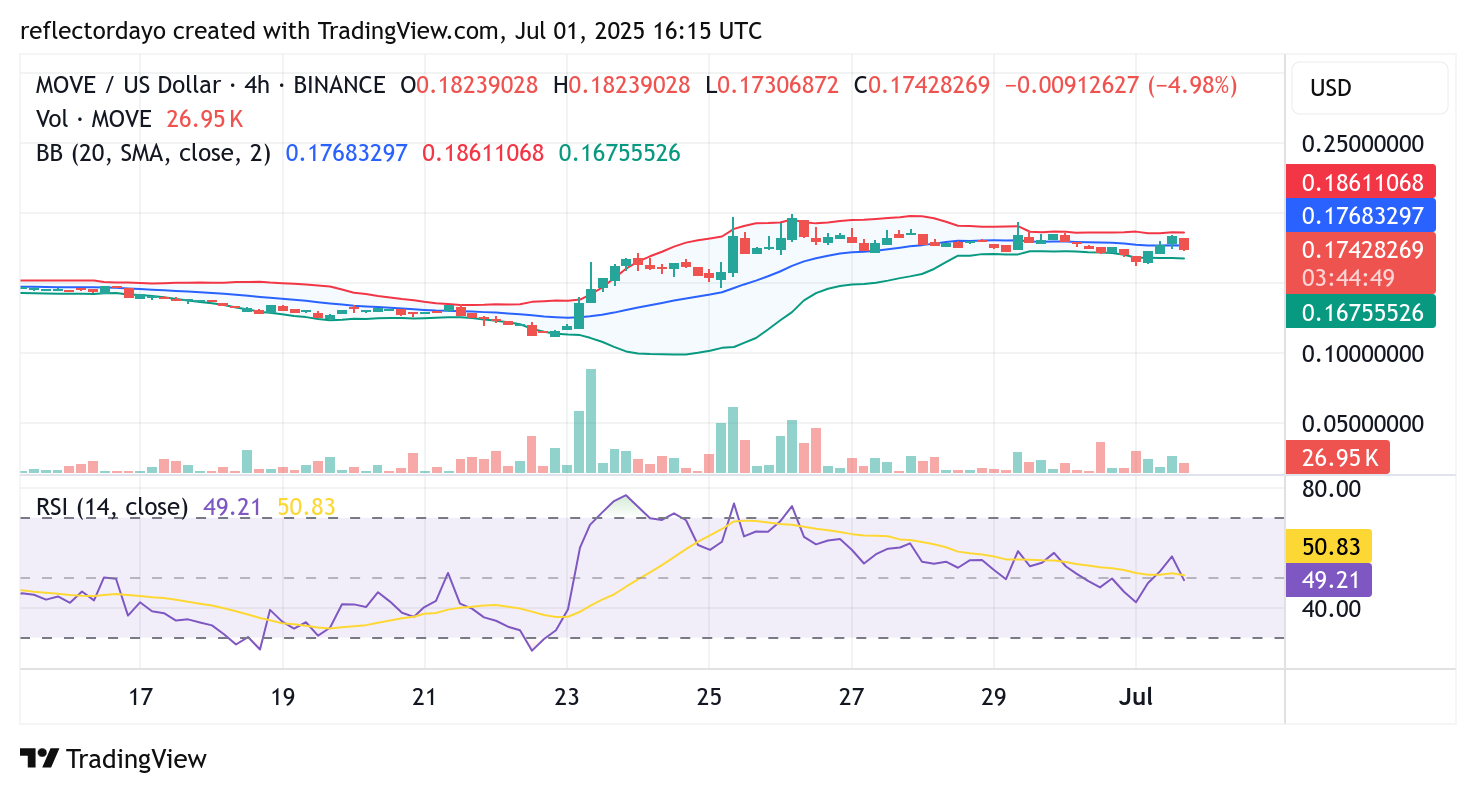
MOVE/USD 4-Hour Chart: Price Stabilizes at $0.15 as Bulls Gain Ground and Market Eyes Breakout
The MOVE/USD market has shown signs of stability around the $0.15 support level, which has now emerged as a key base for bullish activity. Since establishing this threshold, price action has oscillated within a tightening range, reflecting an ongoing battle between buyers and sellers.
This struggle has centered around the $0.18 level, a zone where market direction remains uncertain. A minor higher support has also formed at $0.16, further strengthening the current structure and limiting downside movement.
As consolidation deepens, the Bollinger Bands have narrowed significantly, suggesting that market volatility is compressing and a decisive move is imminent. With pressure building and all eyes focused on the $0.18 resistance level, traders are closely watching for a potential breakout that could define the next trend.