OFFICIAL TRUMP (TRUMP/USDT) Faces Critical Price Consolidation: What’s Next?
Estimated Reading Time: 3 minutes
Don’t invest unless you’re prepared to lose all the money you invest. This is a high-risk investment and you are unlikely to be protected if something goes wrong. Take 2 minutes to learn more

The price of Official Trump against Tether is currently experiencing a period of consolidation after a heavy fall, now stuck within immediate resistance and support levels. The current state of the pair shows that volume has gone down by 0.81% today as traders await a clear signal to see if the price will test a new resistance level or gear up for another downward move.
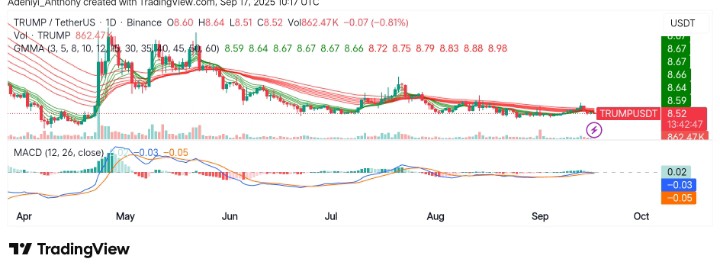
Currently, the Guppy Multiple Moving Averages (GMMA) and MACD are showing straight lines, and as it stands, Official Trump trades at $8.52, recording over 860 thousand daily traded volumes.
Technical Indicators
Major Resistance Levels: $8.64, $8.72, and $8.98
Major Support Levels: $8.49, $8.40, and $8.30
TRUMP Technical Analysis
Technically, the daily chart for Official Trump against Tether has been characterized by a tightening range and indecisive actions from the bulls and bears. The GMMA suggests a lack of directional momentum in either direction as the market remains neutral with balanced buying and selling pressure.
Additionally, the MACD has shown slight positive divergence over the past few days; this could signal a potential bullish reversal, but the current outlook suggests the market remains weak and cautious.
To this end, for a bullish reversal, a trade above $8.72 with increasing volume is needed; otherwise, the pair risks further downside.
🚀 $TRUMP is quietly coiling around the $8.5 zone after a brutal –90% drop.
One tweet or public mention from Donald Trump himself could flip the chart in seconds. 📈
This setup looks like pure calm before the storm eyes on the next headline. pic.twitter.com/W1pZ5GFHL4
— CHOW TRADE (@TradeChow) September 15, 2025
However, despite recent happenings with TRUMP, @TradeChow has stated the possibility of coiling upward after the current oscillation around $8.50. emphasizing that the setup looks calm, and a big may be initiated very soon.
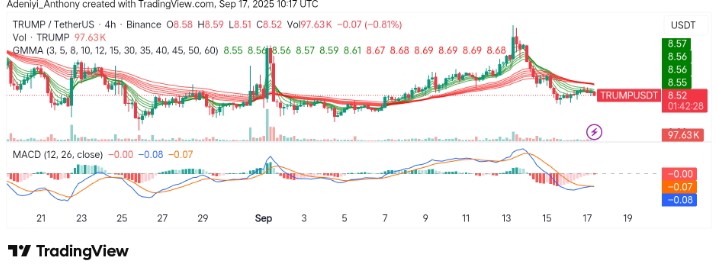
TRUMP/USDT Analysis: Will Bearish Slide Continue?
The analysis of TRUMP/USDT on the 4H chart appears to be calm as suggested earlier, as the pair consolidates below $8.59 after multiple rejections. The GMMA, on one hand, indicates a mixed signal, as the lines of the set of EMAs appear woven together. On the other hand, the MACD operates in the negative region, though the histogram suggests waning bearish momentum.
As it stands, the volume appears to be decreasing compared to the previous session, showing the intending bullish reversal might be place on hold. To this end, failure to break above $8.59 could see the price testing lower support near $8.40, while a move above the former would ignite a move to test another upper limit.
You can purchase crypto coins here. Buy Crypto