OFFICIAL TRUMP (TRUMP/USDT) Struggles at Critical Support: Will a Reversal Happen?
Estimated Reading Time: 3 minutes
Don’t invest unless you’re prepared to lose all the money you invest. This is a high-risk investment and you are unlikely to be protected if something goes wrong. Take 2 minutes to learn more

Official Trump against Tether has consolidated after a gradual drop to the south. However, the pair appears to be struggling to return to the initial position by building a base around the $7.70 support level.
The most recent action shows that the price is facing a close resistance at the $7.92 to $8.02 region, as the Guppy Multiple Moving Averages (GMMA) and stochastic RSI signals oversold condition for the pair. As it stands, the market sentiment may begin to change if the pair can manage to hold above the immediate resistance; otherwise, the pair will continue to oscillate at the current spot or extend the bearish run.
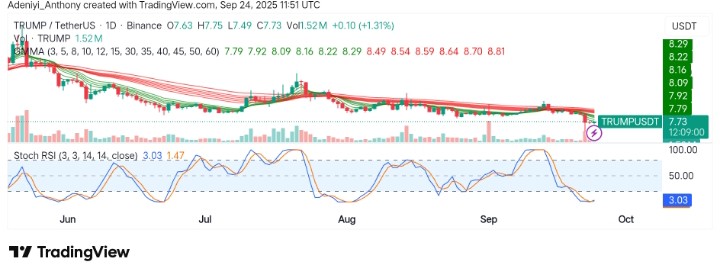
Currently, OFFICIAL TRUMP trades at $7.73 with more than 1.5 million traded volumes for the day.
Technical Indicators
Major Resistance Levels: $7.92, $8.22, and $8.50
Major Support Levels: $7.70, $7.63, and $7.49
TRUMP Technical Analysis
The technical analysis of Official Trump against Tether appears to be displaying a bullish flag pattern as the price consolidates between a tight region after an extensive move to the south, as indicated by the GMMA. Also, the Stochastic RSI seems to be gaining traction from an oversold region on the daily timeframe. However, this condition suggests a buy signal only if the price is higher than the prescribed resistance level.
From another angle, the overall condition of the pair appears to be improving from the June swing low. This suggests Trump could see a move to the upside. However, indicators like MACD still read negative, but the 200-day EMA suggests a new value of $11.28 in the near term, indicating a break above $7.92 might trigger strong buying pressure.
Easily the best play this cycle. IDC if you hate the man, THIS is the best opportunity to long the most powerful and most able KOL to shill your bags. Hes gonna send this to ATH with the upmost haste. https://t.co/tU8CQutu9L pic.twitter.com/8hgtHropHA
— Playmaker Trades (@Playmakerxciii) September 22, 2025
Meanwhile, @playmakerxciii opines that Trump is in its best cycle. This suggests that the perspective on the founder does not matter. However, one thing is certain: he (the founder) will send it to a new high as time goes on.
TRUMP/USDT Analysis: Is Reversal Imminent?
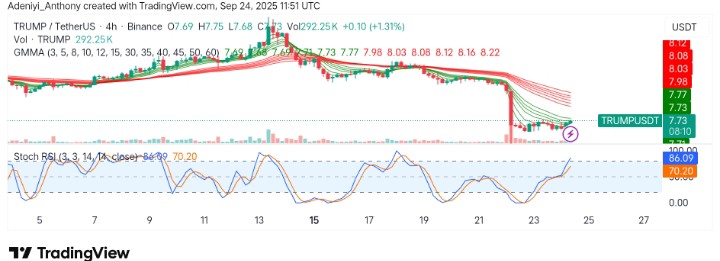
On the 4H chart, TRUMP/USDT continues to struggle below $7.92 resistance with key support at $7.49. However, the Stochastic RSI and GMMA appear to be approaching the overbought region, suggesting the price may cool down soon unless buyers start to step in.
To this end, the $8.22 minor resistance will be exposed if the price breaks above $7.92 in the coming session; otherwise, failure to hold above $7.49 will lead to the retest of the lower support zone.
You can purchase crypto coins here. Buy Crypto