Polygon (POL) Price Prediction: POL/USDT Attempts to Maintain Above the $0.5300 Mark
Estimated Reading Time: 3 minutes
Don’t invest unless you’re prepared to lose all the money you invest. This is a high-risk investment and you are unlikely to be protected if something goes wrong. Take 2 minutes to learn more
Polygon (POL) Price Prediction: August 24
Price activity in the Polygon market can be seen hovering just above the $0.5300 mark. Nevertheless, this seems to be an impressive feat following a sudden spike three sessions ago, which seems to have attracted the attention of bears.
POL/USDT Long-term Trend: Bearish (Daily Chart)
Key Price Levels:
Resistance: $150, $160, $170
Support: $140, $130, $120
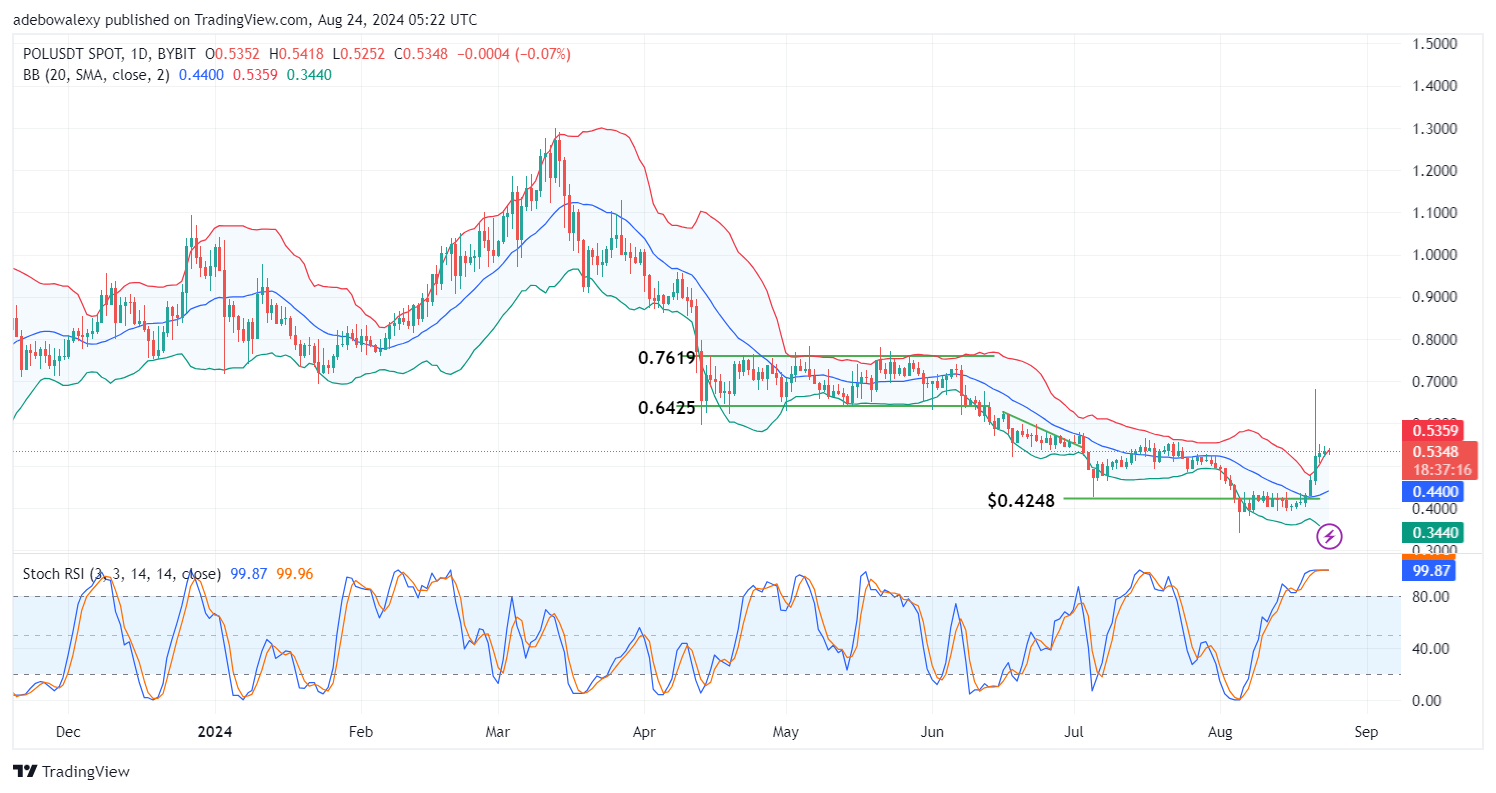
The current trend in the Polygon daily market suggests that price forces are in a standoff, leading to sideways price action. The corresponding price candle for the ongoing session appears red while hugging the uppermost band of the Bollinger Bands (BB) indicator. Meanwhile, the Stochastic Relative Strength Index (Stochastic RSI) lines can be seen moving sideways across the indicator around the 100 level.
Polygon (POL) Price Prediction: POL/USDT Attempts to Secure an Elevated Support
The prevailing movement in the POL/USDT daily market suggests that market forces are at an impasse, resulting in a mostly stagnant market. However, the appearance of the last price candle on the chart suggests that bears are attempting to assert some dominance.
Nevertheless, the position of the last price action suggests that bullish forces may quickly regain control. Similarly, the Stochastic RSI lines are moving sideways and have not delivered a bearish crossover. The behavior of the Stochastic RSI still hints at the possibility of bullish forces resuming action soon.
Polygon (POL) Price Prediction: POL/USDT Eyes the $0.5500 Resistance (4-Hour Chart)
The trajectory of price activity in the Polygon market still appears directed towards the resistance at the $0.5500 price level. However, a downward retracement has occurred in the ongoing session, which appears minimal considering the overall position of price action in the market.
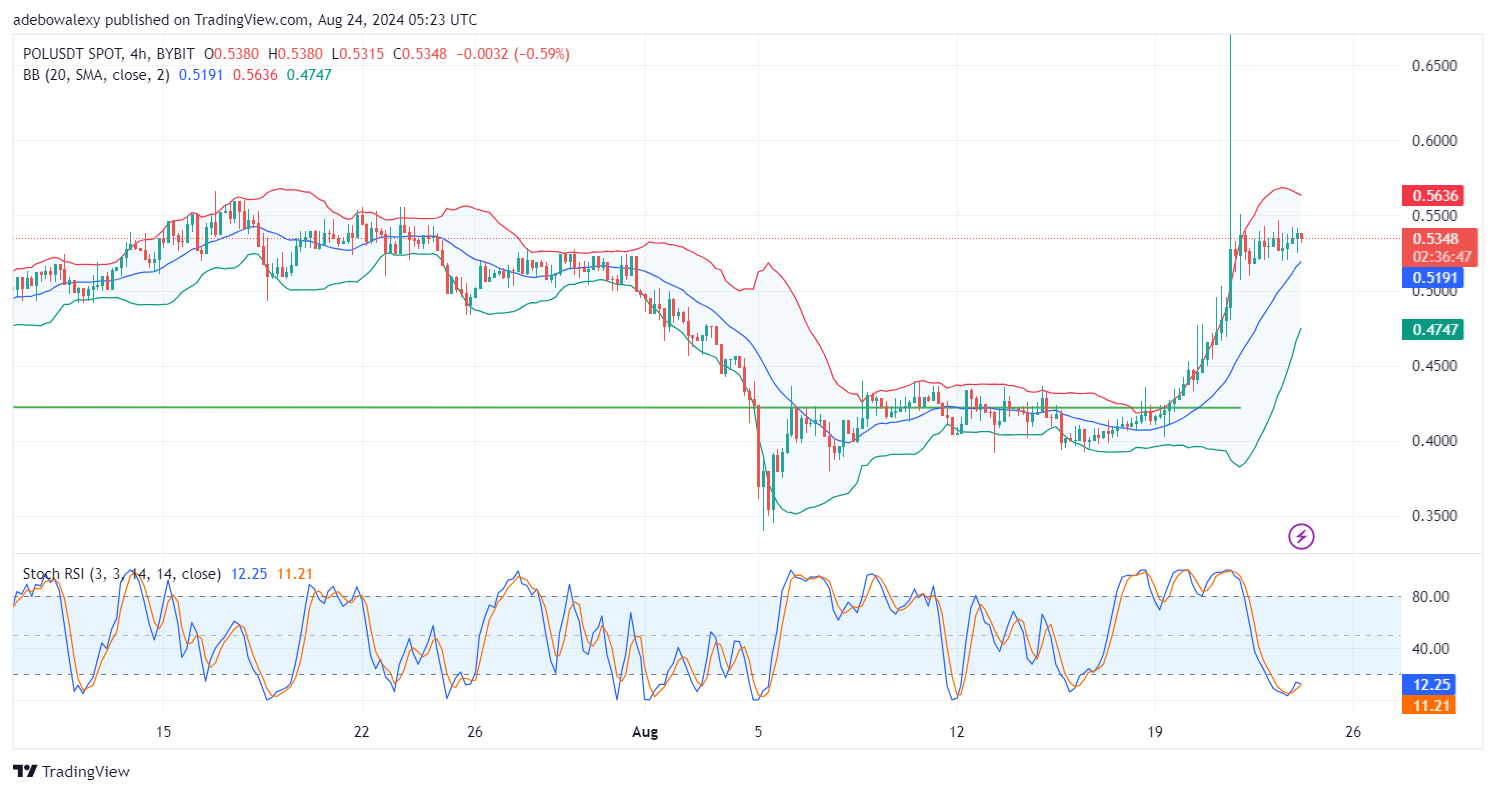
The BB indicator itself has an upward trend, signaling the overall market trend. The Stochastic RSI shows an upward path in the oversold region, but its lines are converged at the observed retracement in the session. At this point, traders can wait until the market recovers from the retracement before aiming for the $0.5500 mark.