Polygon (POL) Price Prediction: POL/USDT Stays Pressurized Toward Lower Support Levels
Estimated Reading Time: 2 minutes
Don’t invest unless you’re prepared to lose all the money you invest. This is a high-risk investment and you are unlikely to be protected if something goes wrong. Take 2 minutes to learn more

Polygon (POL) Price Prediction: September 7
The Polygon market had earlier staged what seemed like a bullish breakout about seventeen sessions ago. However, headwinds resisted further progress, and as a result, the market was forced to retrace to lower price levels and now trades below the $0.4000 threshold.
POL/USDT Long-term Trend: Bullish (Daily Chart)
Key Price Levels:
Resistance: $0.4000, $0.5000, $0.6000
Support: $0.3500, $0.3000, $0.2500
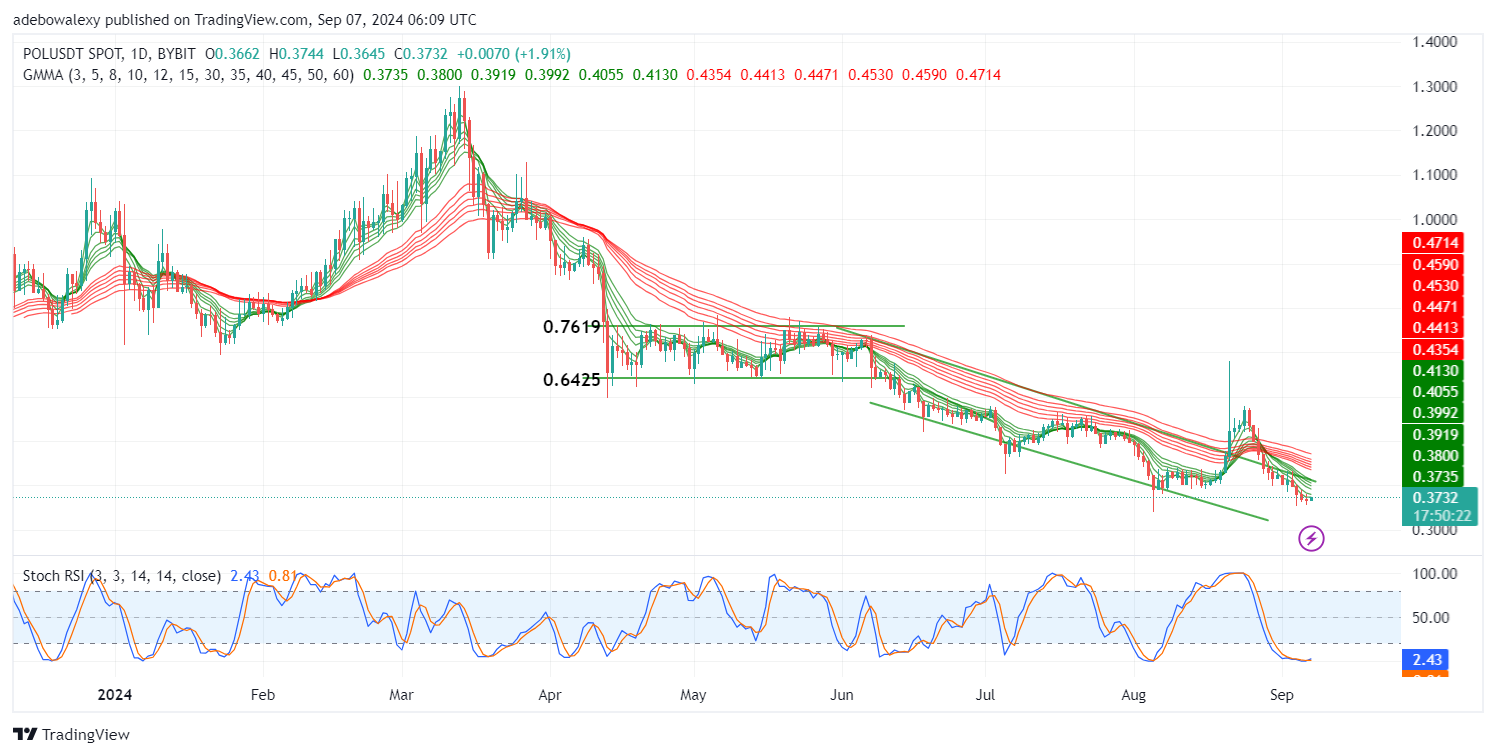
The POL/USDT daily market has been steadily retracing to lower prices since price action fell through the sideways price channel on June 11th. Price activity in the market has now retreated below all the Guppy Multiple Moving Average (GMMA) lines. Meanwhile, the Stochastic Relative Strength Index (Stochastic RSI) lines are in the overbought region.
Polygon (POL) Price Prediction: POL/USDT May Still Head South
Price activity in the Polygon market maintains a high propensity toward the $0.3000 price level. The most recent price candle has appeared below all the GMMA indicator lines, and the Stochastic RSI lines are in the oversold region. For some time, the indicator lines have dragged sideways in that region of the technical indicator.
As a result, the ongoing session has seen minimal upward retracement, lacking the needed push for further upside advancement. Nevertheless, traders can zoom in to check for near-term upside opportunities.
Polygon (POL) Price Prediction: POL/USDT May Have Near-term Opportunities (4-Hour Chart)
While price activity in the Polygon daily market seems largely subdued, the 4-hour market suggests that the token may present short-term opportunities. Here, price action can be seen rising past all the green sets of GMMA indicator lines. Similarly, the Stochastic RSI lines are rising steadily upwards.
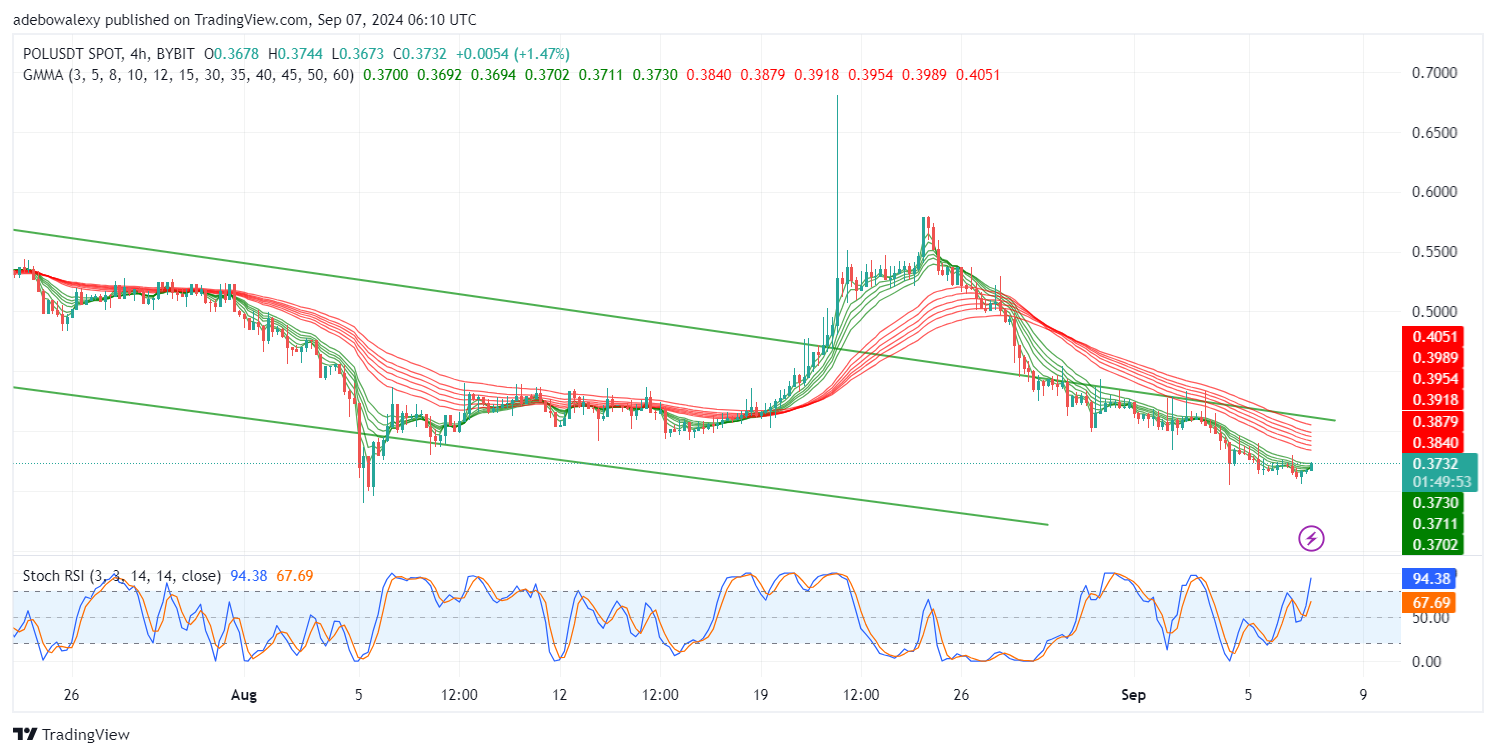
Technically, these factors suggest that upside momentum is gaining strength. As a result, short-term traders may gather gains below the $0.3500 price mark. Nevertheless, it’s important to take precautions against unforeseen market events.