Solana (SOL) Price Prediction: SOL/USDT Makes Its Way Towards the $160 Mark
Estimated Reading Time: 3 minutes
Don’t invest unless you’re prepared to lose all the money you invest. This is a high-risk investment and you are unlikely to be protected if something goes wrong. Take 2 minutes to learn more

Solana (SOL) Price Prediction – July 4, 2025
Even as the Bitcoin market has been experiencing some notable movement recently, the Solana market has also been rising toward previously lost price levels. Trading indicators on the token’s price chart remain positively biased and continue to suggest bullish momentum. More details lie below.
SOL/USDT Long-Term Trend: Bullish (Daily Chart)
Key Price Levels
Resistance: $155, $160, $165
Support: $150, $145, $140
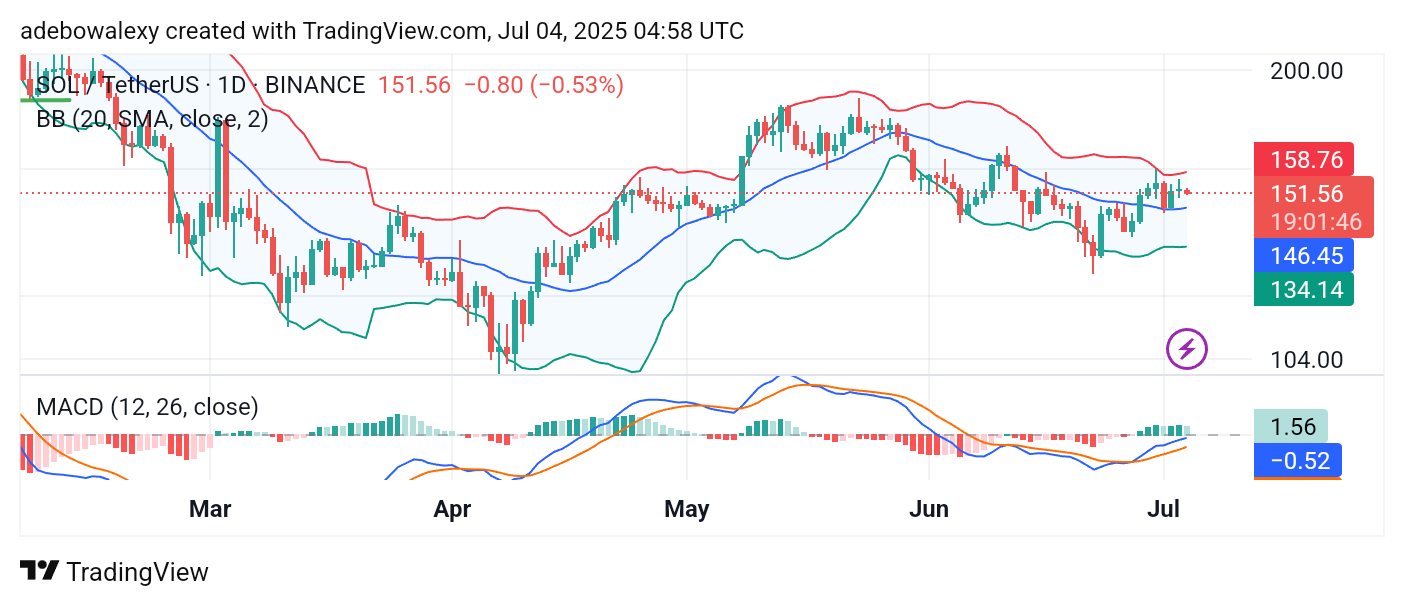
The Solana market recently rebounded upward, with the rebound occurring off the lower limit of the Bollinger Bands (BB) indicator. Price action has since climbed through the middle band of the BB and even tested the upper limit, although it has not broken through. The most recent price candle is red but remains above the middle limit of the BB. Likewise, the Moving Average Convergence Divergence (MACD) indicator lines are steadily rising toward the equilibrium level, and the histogram bars are still above the equilibrium line, reinforcing the bullish outlook.
Solana (SOL) Price Prediction: SOL/USDT Has the Potential to Breach the $160 Mark
Price action in the Solana daily market is currently at a temporary pause. However, the market remains well positioned for a continuation of the upward trend. The ongoing session is represented by a red price candle that stands above the middle band of the BB indicator.
The BB indicator itself appears widely spread and ready to accommodate further price increases. The MACD trajectory continues upward, with histogram bars remaining above the equilibrium level. Consequently, the market still shows potential to climb higher in the near term.
Solana (SOL) Price Prediction: SOL/USDT Moves Sideways for Now (4-Hour Chart)
As noted earlier, the Solana market appears to be moving sideways at the moment. The last three price candles on the 4-hour chart show sideways movement just above the middle band of the BB indicator.
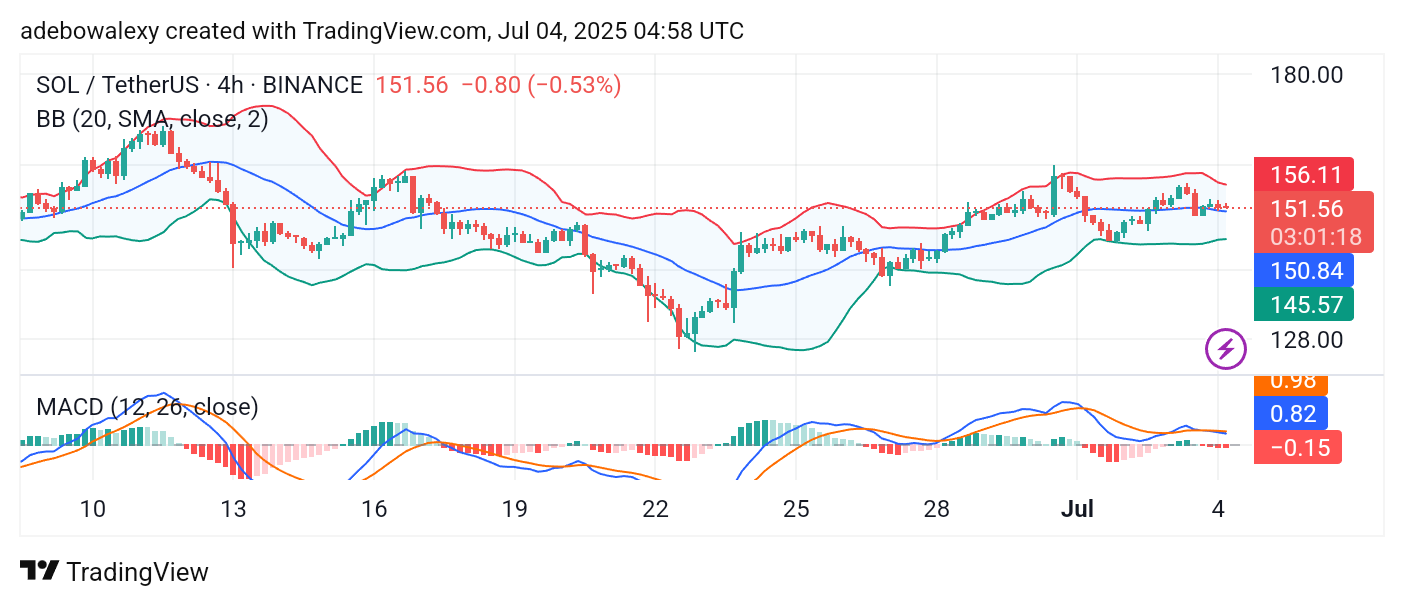
Similarly, the MACD lines are moving sideways above the equilibrium level after a recent crossover. Meanwhile, the upper and lower bands of the BB indicator are converging, which typically suggests an upcoming breakout. Technically, this may lead to a bounce from the middle band and a possible surge toward the $160 price level shortly.