Solana (SOL/USD) Trade Swings Up, Holding Increases
Estimated Reading Time: 3 minutes
Don’t invest unless you’re prepared to lose all the money you invest. This is a high-risk investment and you are unlikely to be protected if something goes wrong. Take 2 minutes to learn more
Solana Price Prediction – March 30
Recently, a convergence trade pattern has occurred to cause a line of short lows that lacked a long trending path that doesn’t create conducive environments for sellers, given that the crypto trade swings up, increasing inputs.
The middle Bollinger Band trend line has been moving northward over the course of a few sessions in order to maintain the baseline mode at the bottom of each candlestick formation. The oscillators are positioned at lower zones with a sequence of different promissory smaller bullish candlesticks that indicates there is little possibility for declining force to support further moves to the downside.
SOL/USD Market
Key Levels:.
Resistance levels: $220, $240, $260
Support levels: $160, $140, $120
SOL/USD – Daily Chart
The SOL/USD daily chart reveals that the crypto-economic market swings up, increasing inputs.
The Bollinger Band trend lines have been managing to place northward, as the lower part of the indicators is portending a supportive zone around the value line at $160. The stochastic oscillators are in a decreasing trading zone, indicating that moves to the downside appear to be lacking in strength.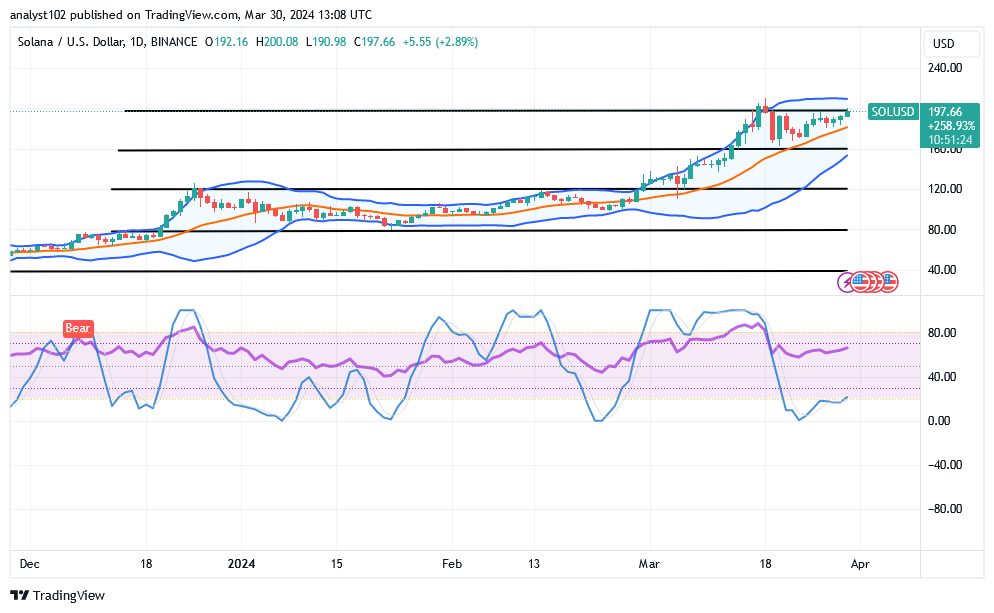
Which trade level, currently trading at $197, will be the pivotal line opposing the current gains in the SOL/USD market?
The market level that the present-up rising force should be wary of pushing downward past in the run is located around the point of $160, given that the SOL/USD market currently swings up, keeping up inputs.
Price upswings have been finding their bases for recovery in the upper and intermediate Bollinger Band positioning positions. In light of this, a sharp southerly push against the indicator’s middle will likely be a long-term return to lower Bollinger Band areas.
It is necessary for bears to be positioned carefully around the higher Bollinger Band trend line zones. Once the stochastic oscillators cross over to realign themselves around the overbought area, sellers will have improved trading circumstances to reclaim entries.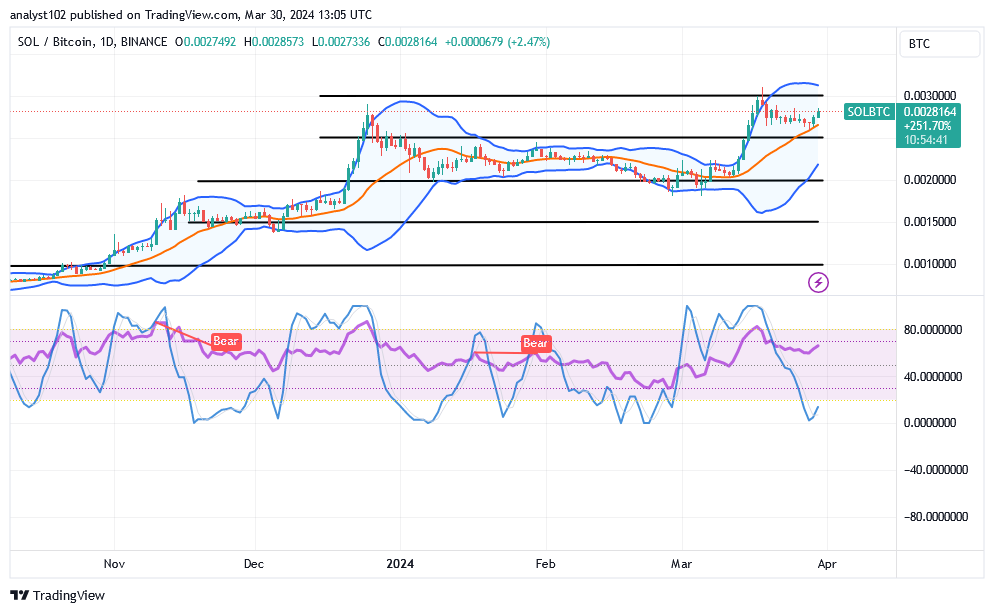
SOL/BTC Price Analysis
In contrast, the market operations of the Solana trade swing up against Bitcoin, keeping inputs from the zone of the middle Bollinger Band trend line.
The Bollinger Band indicators are set up to indicate when a correction has reached a level of completion at its middle line. The blue portion of the stochastic oscillators is situated in the oversold area. That indicates that the core cryptocurrency industry anticipates growing in opposition to its counter-trading crypto economy.
Note: Cryptosignals.org is not a financial advisor. Do your research before investing your funds in any financial asset or presente product or event. We are not responsible for your investing results.
You can purchase Lucky Block here. Buy LBLOCK