Uniswap (UNI) Price Prediction: UNI/USDT Breaks an Important Support Level
Estimated Reading Time: 3 minutes
Don’t invest unless you’re prepared to lose all the money you invest. This is a high-risk investment and you are unlikely to be protected if something goes wrong. Take 2 minutes to learn more

Uniswap (UNI) Price Prediction: August 1
As we all know, most cryptocurrencies possess some degree of correlation to Bitcoin. This characteristic has been portrayed in the Uniswap market as it broke through a month-old support level today. This can be attributed to the continued decline of BTC price.
UNI/USDT Long-term Trend: Bearish (Daily Chart)
Key Price Levels:
Resistance Levels: $8.00, $9.00, and $10.00
Support Levels: $6.00, $5.00, and $4.00
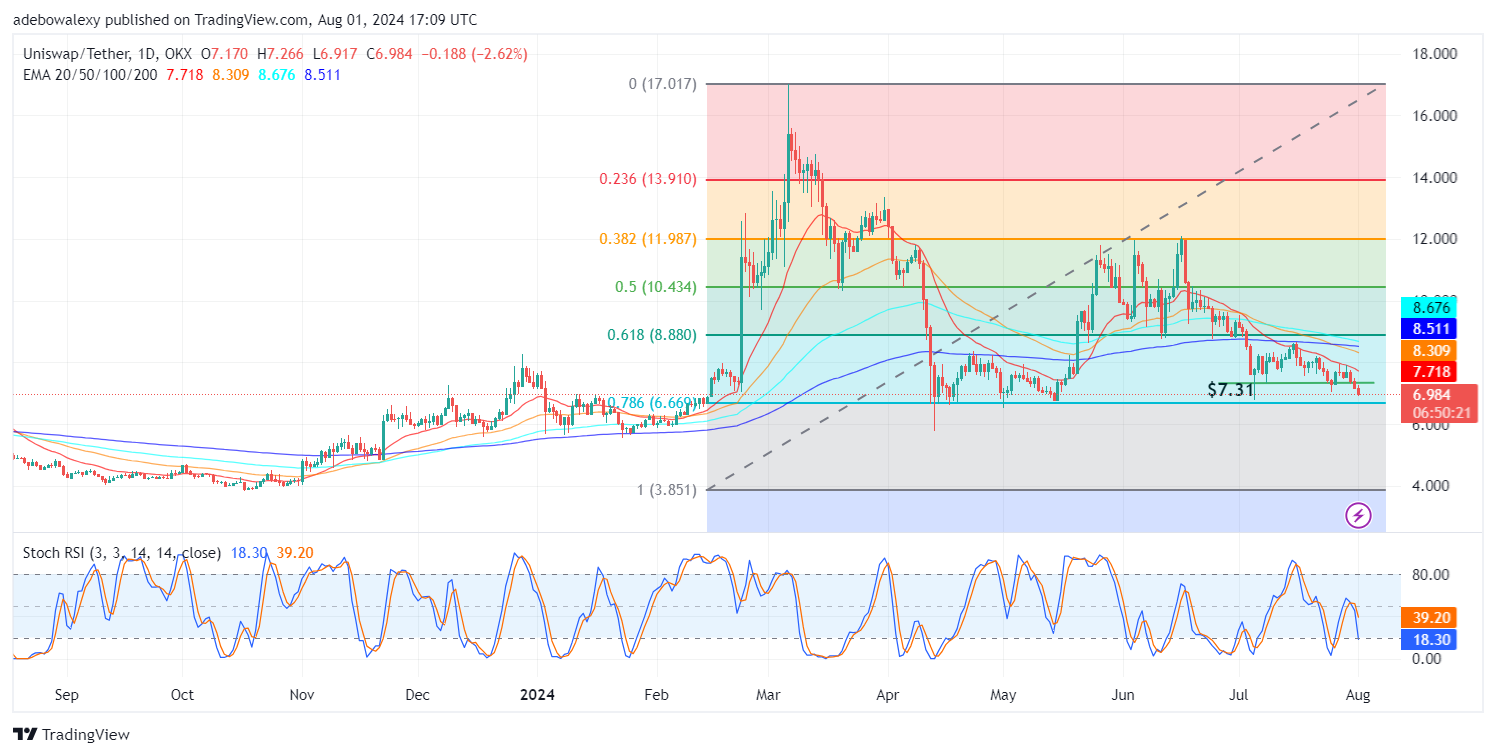
On the Uniswap daily market, price action has dipped below the $7.31 price level. This support level has been held for about a month. As a result, price action has continued to trend downward below all the Exponential Moving Average (EMA) lines. Additionally, the Stochastic Relative Strength Index (SRSI) lines exhibit a sharp downward trajectory, with the leading line falling below the 50 threshold of the indicator.
Uniswap Price Prediction: UNI/USDT Market Eyes a New Technical Support Level
Based on the available price candle below the $7.31 threshold, we can see that price activity has remained below this level for about two sessions. Today’s trading activity has kept the token trading below that price level.
The position of price action below all the EMA lines suggests that downward forces are dominant. Likewise, the trajectory of the SRSI indicator lines also indicates that price action will most likely continue its bearish path toward lower price levels. Therefore, traders can still anticipate the nearest technical price level.
UNI/USDT Medium-term Trend: Uniswap Market Presents Divergent Indications (4H Chart)
The UNI/USDT market remains below all the EMA lines even on a 4-hour market price chart. The ongoing session, as represented by the last price candle, hints that bears are maintaining control of price movement. However, the SRSI indicator lines are rising up and out of the oversold region, presenting contradictory signs in this market.
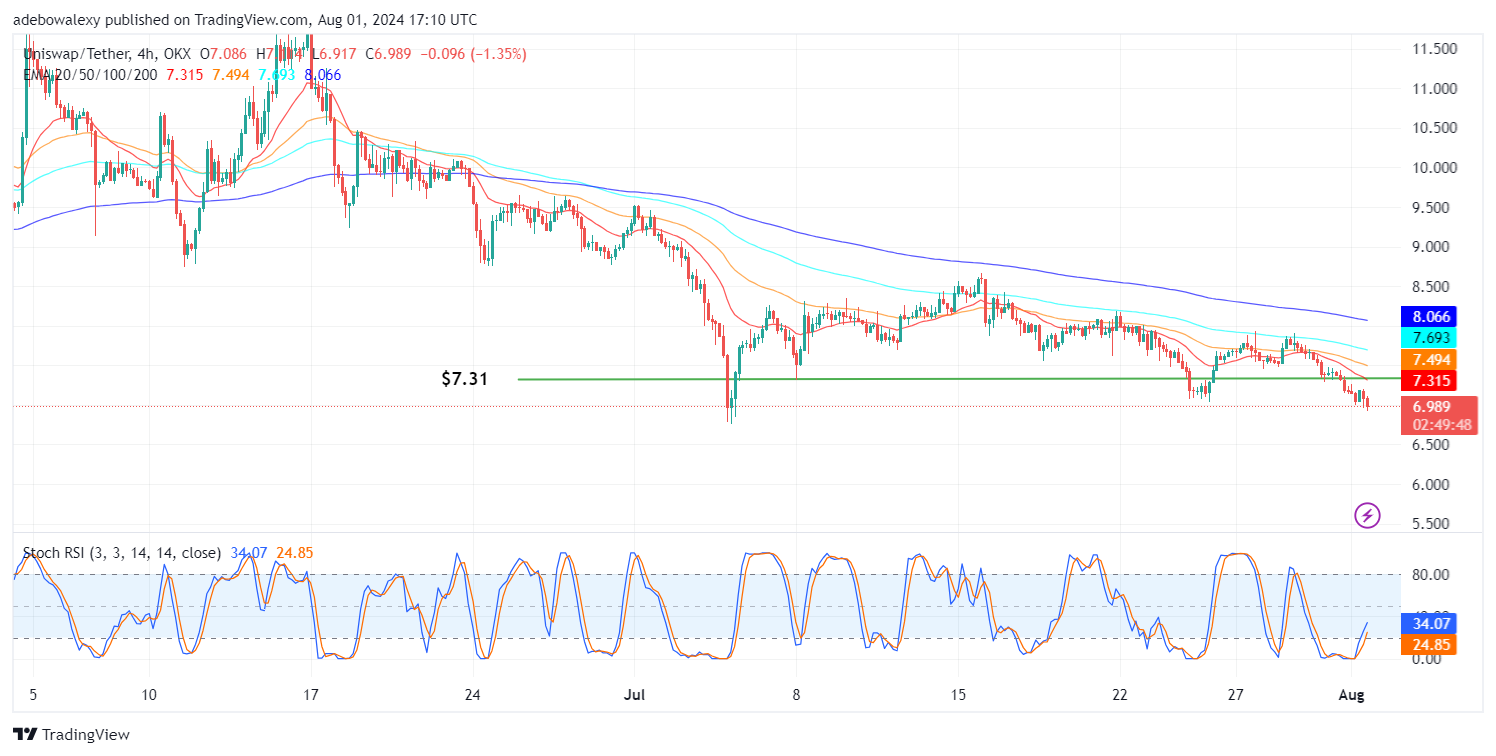
Nevertheless, the market still has bearish characteristics, and the downward correction may be short-lived. As a result, it seems safe for traders to anticipate short-term gains. Therefore, the $6.50 price level should be a more realistic target.