Uniswap (UNI) Price Prediction: UNI/USDT Retreats
Estimated Reading Time: 2 minutes
Don’t invest unless you’re prepared to lose all the money you invest. This is a high-risk investment and you are unlikely to be protected if something goes wrong. Take 2 minutes to learn more

Date: June 4, 2025
Although the Uniswap market had previously shown the potential to breach resistance at the $8.00 price level, it appears the bulls lack the necessary momentum to complete that move. A more careful analysis is warranted at this point.
UNI/USDT Long-Term Trend: Bearish (Daily Chart)
Key Price Levels:
Resistance: $7.00, $9.00, $11.00
Support: $6.00, $5.00, $4.00
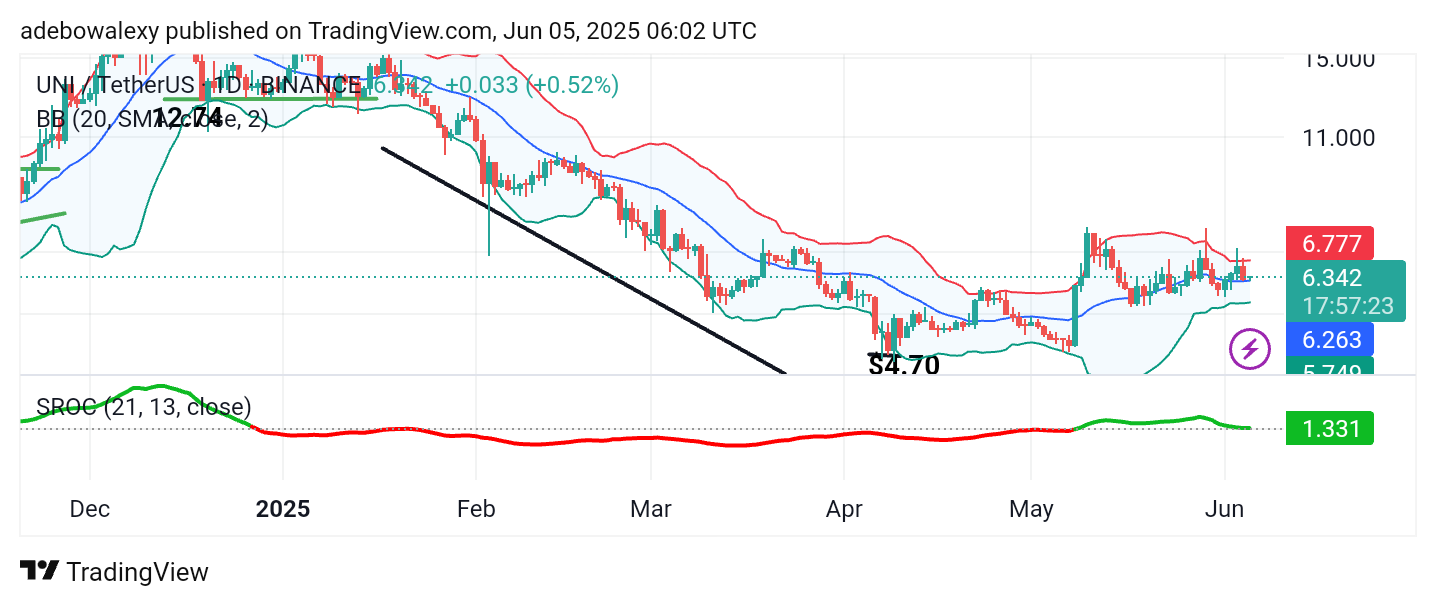
The latest price candle has appeared just above the middle band of the Bollinger Bands indicator. Price action experienced a strong downward retracement in the previous session; however, the current session shows a slight recovery, with the candle appearing green just above a key support level. Additionally, the Bollinger Bands have contracted slightly and are beginning to turn upward, signaling potential volatility. Meanwhile, the Smoothed Rate of Change (SROC) indicator is flattening as it approaches the equilibrium level, indicating indecision in the market.
Uniswap (UNI) Price Prediction: Can UNI/USDT Proceed Upward?
Uniswap price action remains above the middle line of the Bollinger Bands, which is a critical technical level. Although the latest candle is relatively small, its position above the mid-band supports a cautiously bullish outlook.
Furthermore, the SROC indicator suggests the market may be preparing for an upward rebound. The upward trajectory of the SROC line indicates that bullish forces are still in play. Consequently, traders can remain cautiously optimistic about a potential continuation to the upside.
Uniswap (UNI) Price Prediction: UNI/USDT Looks Pressured
On the 4-hour chart, Uniswap appears to be under bearish pressure. The last two candles have shown minimal gains, and price action continues to lie below the middle Bollinger Band. However, price movement seems to be inching toward that midline, now acting as resistance.
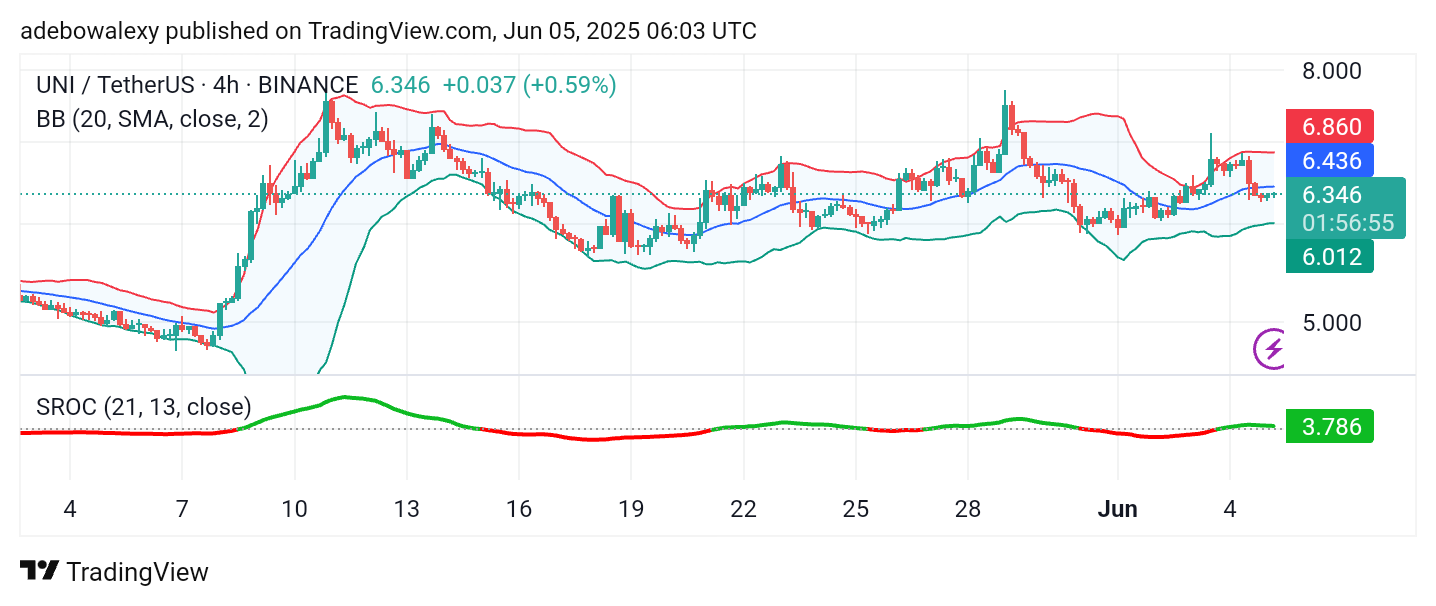
The SROC indicator hovers just above the equilibrium level, hinting at a neutral-to-bullish bias. While short-term upside potential remains, caution is advised. Short-term traders may aim for the $7.00 level but should remain alert to possible reversals.