Wall Street Memes (WSM) Trade Hovers and Building Spikes
Estimated Reading Time: 3 minutes
Don’t invest unless you’re prepared to lose all the money you invest. This is a high-risk investment and you are unlikely to be protected if something goes wrong. Take 2 minutes to learn more

Wall Street Memes Price Prediction – February 28
Pricing actions that have persistently featured in the pace of motions pushing that put buyers against sellers in the business operations of the WSM/USD market have remained tentatively deepening their stances, as the crypto-economic trade now hovers and builds spikes toward the support of $0.001.
The market is currently signaling that an optimal buying opportunity may have been reached, as the price has moved southward to touch the lower trend line of the Bollinger Bands. The horizontal support level at $0.001 highlights a key area where sellers should exercise caution, as any further intensification in price declines could lead to potential reversals or support-based buying pressure.
WSM/USD Market
Key Levels
Resistance levels: $0.002, $0.0025, $0.003
Support levels: $0.001, $0.0008, $0.0006
WSM/USD – 4-hour Chart
The medium-term chart (4-hour chart) of the WSM/USD trade currently hovers and builds spikes alongside the lower Bollinger Band indicator.
The stochastic oscillators’ positioning within the oversold region suggests caution for bearish traders, as there is a potential for the underlying asset to be undervalued further. The Bollinger Bands indicators have shifted downward, with price action currently oscillating between $0.0015 and $0.001.
Will the selling moves finally become uncontrollably concentrated, given that the WSM/USD trading prices are still holding near $0.001?
Even if the current way of pulling downward might tend to get more forces, the resultant end will be to put in for lower decent dip buys, given that the WSM/USD market hovers and building spikes also in the trade processes.
As the WSM/USD market continues to show progress in the upcoming trading sessions, it is expected that buyers will need to maintain consistent efforts in accumulating positions. Currently, price levels near the lower trend of the Bollinger Band should be closely monitored, as they may offer key entry points for further upward momentum.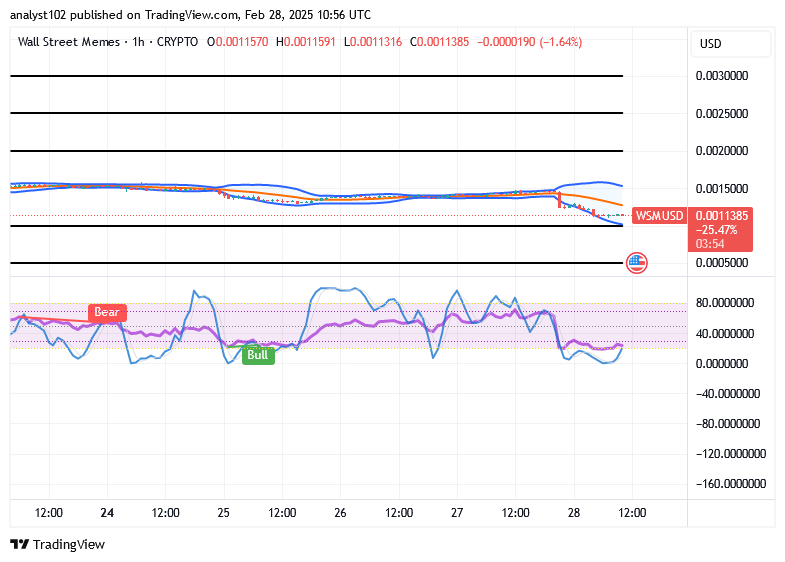
WSM/USD 1-hour chart
The 1-hour chart from the technical picture of the short-term setup showcases that the WSM/USD market hovers and builds spikes in inputs.
The current positioning of the stochastic oscillators indicates they remain in the oversold region, yet retain the potential to trigger a bullish reversal in the near term. The downward pressure observed in recent candlestick formations has resulted in lower lows and lower highs, predominantly within the middle and lower Bollinger Bands zones. The $0.001 price level is identified as a critical support zone, with the likelihood that the price will reverse and push upward from this point.
“Hey, you should hop into our Telegram group — we’ve got the top crypto picks!”
“Bro you should join our telegram chat we got the best crypto calls”
— Wall Street Memes (@wallstmemes) February 27, 2025
The telegram chat: pic.twitter.com/gdRSgmaJZi
Buy and stake WSM now!: Wall Street Meme (WSM)