Wall Street Memes (WSM) Trade Is On, Making Rising Attempts
Estimated Reading Time: 3 minutes
Don’t invest unless you’re prepared to lose all the money you invest. This is a high-risk investment and you are unlikely to be protected if something goes wrong. Take 2 minutes to learn more

Wall Street Memes Price Prediction – April 13
Exhibition of most lower lows below the major trade line of $0.001 as it involves the reactions of bulls and bears in the operations of Wall Street Memes coin versus the material worth of the US currency has been to let there be a room for getting the base instrument at reasonable reduced costs, given that the pairing market is on, making rising attempts.
A recent touch of the lower Bollinger Band may signal the beginning of a momentum shift, potentially setting the stage for a long position. This interaction with the band suggests the market could be gearing up for a rebound, aligning with current price behavior. Supporting this view, oscillators are also trending downward into oversold territory, reinforcing the likelihood of a buying opportunity forming below the $0.001 level.
WSM/USD Market
Key Levels
Resistance levels: $0.0015, $0.002, $0.0025
Support levels: $0.0008, $0.0006, $0.0004
WSM/USD – 4-hour Chart
The WSM/USD medium-term chart setting showcases that the crypto-economic trade is on a positive move, making rising attempts.
The stochastic oscillators have bent southward into the oversold region, indicating that selling pressure might soon be getting exhausted. The Bollinger Bands have continued to stretch steadily eastward, closely hugging the $0.001 trade line. This validates the ongoing sideways movement observed up to the current trading cycle.
Will WSM/USD’s approach to the lower Bollinger Band lead to sustained declines?
It must be noted that there has been no reliable pricing movement to validate the probability index of securing a long-holding pattern to the downside, as the actions have been in ranging styles, given that the WSM/USD trade is on, making rising attempts.
As of this writing, market activity relatively demonstrates a prevailing selling velocity, driving price action into a zone of perceived indecision—particularly for traders lacking a solid grasp of dip-buying strategies and long-term position-holding principles.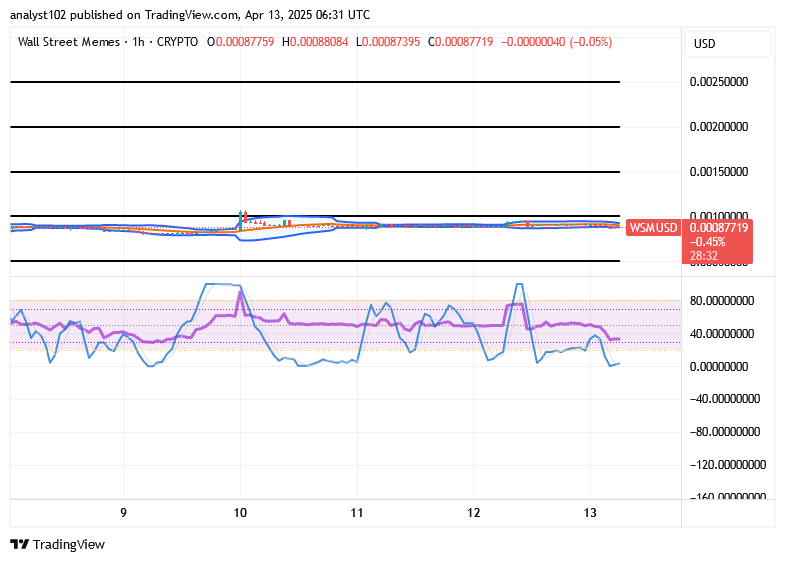
WSM/USD 1-hour chart
The WSM/USD 1-hour chart demonstrates that the short-term arrangement of the crypto-economic trade is on a basement formation, making rising attempts.
The trend lines of the Bollinger Bands indicators have systemically continued stretching in flat, constricted shapes toward the east direction, embodying variant occurrences of candlesticks forming lower lows and lower highs. The stochastic oscillators have decisively traversed into the oversold region, denoting a potential exhaustion point to the stay-on bearish declines.
BIGTIMEUSDT & WSMUSDT Futures Contracts are now officially live on Bybit!
🚀 BIGTIMEUSDT & WSMUSDT Contracts now on Bybit!
— Bybit (@Bybit_Official) October 12, 2023
Dive into new trading opportunities with 1-25x leverage. Plus, they’re now on Bybit Futures Grid Bot! Start trading now.
📈 BIGTIME: https://t.co/FAQlbhnzAh
📈 WSM: https://t.co/pb2y2AfMBE#CryptoTrading #Bybit