XRP (XRP/USDT) Faces Crucial Test as Resistance and Support Levels Guide Next Moves
Estimated Reading Time: 3 minutes
Don’t invest unless you’re prepared to lose all the money you invest. This is a high-risk investment and you are unlikely to be protected if something goes wrong. Take 2 minutes to learn more
The market for XRP against Tether has seen significant movement in the past few months, transitioning from a strong bullish phase to a period of consolidation. As it stands, the market sentiment remains cautious, with XRP testing important support and resistance levels.
Recently, the market awaits confirmation for the next major movement as the price receives guidance from upper and lower limits. However, traders are now keeping an eye on the key resistance zones around $2.97, which have previously capped the upside. However, on the flip side, critical support levels at $2.53 and $2.83 will be crucial in determining whether XRP will continue its upward trajectory or face a deeper retracement.
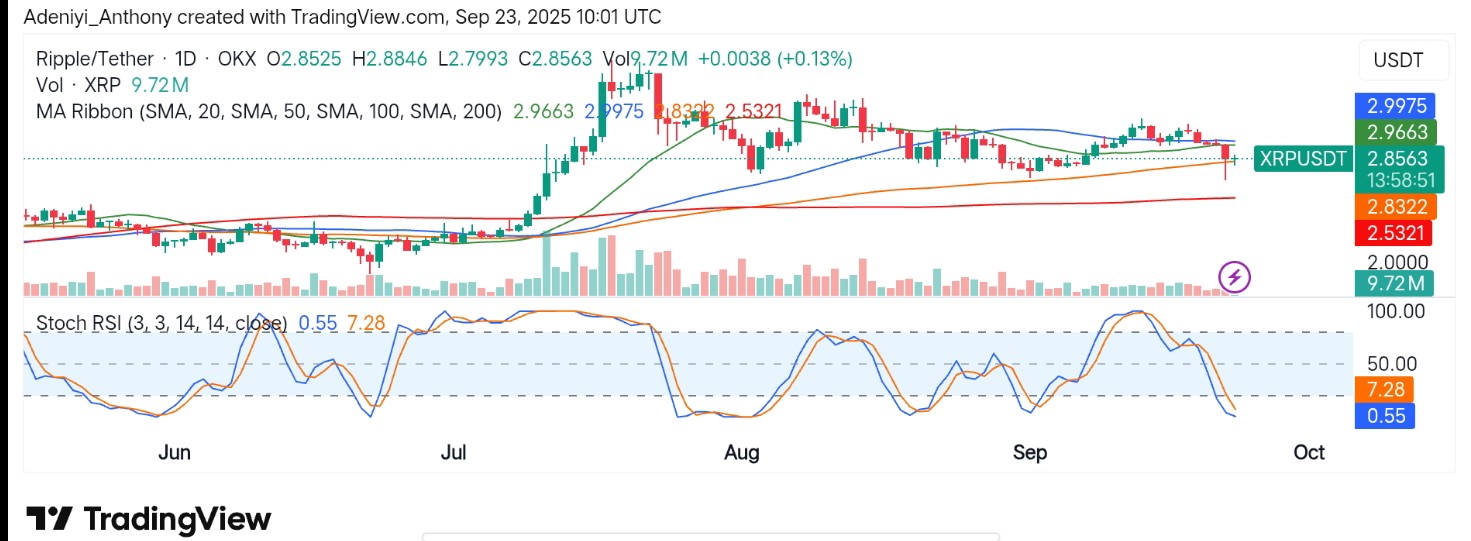
Currently, XRP trades at $2.8563 with more than 9.7 million traded volumes already in the daily timeframe.
Technical Indicators
Major Resistance Levels: $2.9700, $3.300, and $3.500
Major Support Levels: $2.7000, $2.5300, and $2.3200
XRP Technical Analysis
XRP against Tether has been consolidating above its key support zone for a while. However, the activities on the daily timeframe suggest the pair is poised for a potential breakout, as the oversold condition of the Stochastic RSI signals that price may receivme a push to the north soon if momentum builds.
To this end, if the price can break above the $2.9700 resistance zone with increasing volume, an intended move to the upside would be actualized; otherwise, a fall below $2.700 would attract a short-term pullback.
Good News for XRPUSDT and What’s Next?
XRP in an earlier session was extremely bearish, heading drastically towards the $2.700 support level. However, activities on the shorter timeframe show the coin moves within two ranges of values. If the token can find its way above the upper range, a trade towards $3.3 may materialize, but full control over $2.86 is yet to play out. To this end, XRP may continue to hover around $2.9500 and $2.8600 for now.
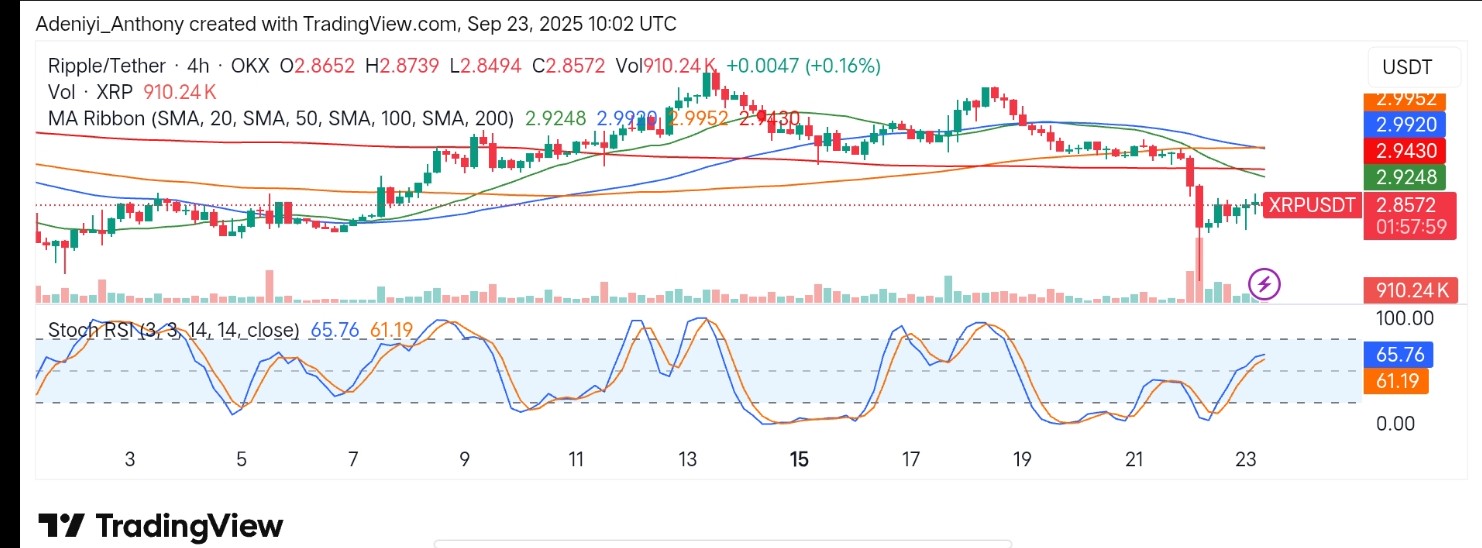
XRPUSDT Short-Term Analysis: Testing Support and Resistance Levels
Based on the 4-hour chart, XRP/USDT is still consolidating within a narrow range after a sharp fall in value, depicting mixed market sentiment. As it stands, the price is testing the $2.85 support level and has recently experienced a minor rebound, with the lines of the momentum oscillator pointing to existing gains ahead.
The 50-period moving average seems to be supporting the price, but the lack of upward momentum above $2.87 raises concerns for a breakout. Should the price fail to hold above this support level, XRP might face further downside toward $2.82. However, if the resistance at $2.87 is overcome, the bullish outlook could resume toward the next key resistance near $2.92.
You can purchase crypto coins here. Buy Crypto