XRP (XRP/USDT) Preparing for the Next Move
Estimated Reading Time: 3 minutes
Don’t invest unless you’re prepared to lose all the money you invest. This is a high-risk investment and you are unlikely to be protected if something goes wrong. Take 2 minutes to learn more
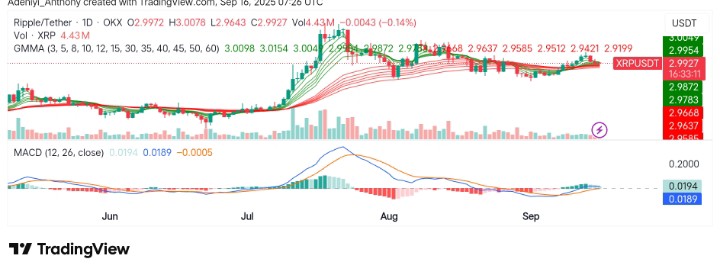
XRP against Tether appears to be neutral at the moment, with recent price action moving within a strong range after a strong bullish trend. In the past weeks, XRP has experienced notable price swings, moving up sharply in the past few weeks, followed by Slight pullback.
Recently, XRP is testing the $2.98 region, which has proven to be a significant resistance level. The market appears to be correcting at the moment, with daily, weekly, and monthly timeframes recording 1.71%, 0.74%, and 4.22%, respectively.
Currently, XRP trades at $2.9972 with over 4.4 million traded volumes. Additionally, the Guppy Multiple Moving Averages (GMMA) and MACD suggest a drop in bullish momentum.
Technical Indicators
Major Resistance Levels: $3.0000, $3.0300, and $3.5000
Major Support Levels: $2.9000, $2.8500, and $2.5000
XRP Technical Analysis
XRP against Tether at the moment is at a critical juncture, testing resistance levels for a decisive next leg of movement. The GMMA lines suggest a consolidation phase, as the shorter-term EMAs are starting to flatten while the longer-term ones are still inclined upwards. This could signal a pause in the uptrend. However, the long-term uptrend remains slightly intact.
On the other hand, the MACD histogram shows signs of weakening bullish momentum. The blue line (MACD) is starting to level off, and the orange signal line is flattening. This could indicate that the recent rally is losing steam.
As it stands, XRP against Tether risks further downside if the pair fails to hold above $3.000, but a sustained hold above this level would indicate another round to the north.
What to do with XRP Now?
Technically, XRP has failed to break above $3.12 in recent trade and has been retesting lower supports. As it stands, the coin appears stable. However, there is a lot of space for XRP to drop into for a great buy opportunity as the token continues to range between the $2 and $3 levels.
XRP/USDT Analysis: Facing Critical Resistance as Price Consolidates
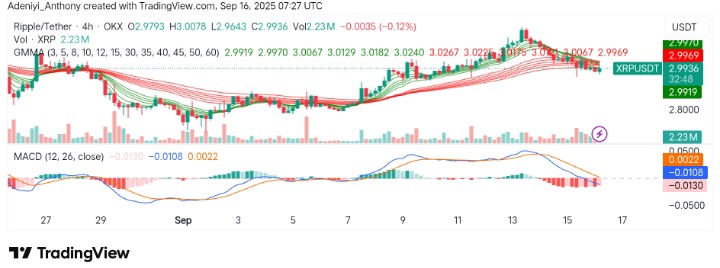
On the 4H chart, XRP/USDT’s recent price action indicates a period of consolidation between $2.95 and $2.99, with a slight downward drift as the market tests the strength of this range.
From one angle, the GMMA signals a weakening upside momentum despite the positioning of the long-period EMAs. This is signaling that the consolidation could be a healthy pause before further upside. On the other hand, the MACD, which has recently crossed into positive territory, suggests that the bullish momentum is not entirely lost, but the recovery is sluggish.
As it stands, the volume and $2.9500 continue to give the market a positive outlook. However, a break below this level could lead to the retest of the $2.9000 area. To this end, a bullish structure may develop if the pair maintains its current stance above immediate support; otherwise, the pair may continue to oscillate or face further correction.
You can purchase crypto coins here. Buy Crypto