XRP (XRP/USDT) Gears Up for Breakout After Strong Base Building
Estimated Reading Time: 3 minutes
Don’t invest unless you’re prepared to lose all the money you invest. This is a high-risk investment and you are unlikely to be protected if something goes wrong. Take 2 minutes to learn more
XRP/USDT Long-term Analysis: Ranging
The market for XRP against the Tether is currently showing signs of strength after spending weeks moving sideways. Price has been gradually rising from a strong support area, indicating that buyers are slowly gaining confidence. However, the candles have started forming higher lows with the volume picking up again.
To this end, the MACD on the weekly chart is crossing above the signal line, indicating momentum may be tending toward the upside. If bulls maintain control, XRP could break out to new highs in the coming weeks.
Currently, XRP trades at $2.8596, recording more than 550 million traded volumes for the week.
Technical Indicators
Major Resistance Levels: $3.0300, $3.3000, and $3.6000
Major Support Levels: $2.600, $2.1800, and $1.9000
XRP Technical Analysis
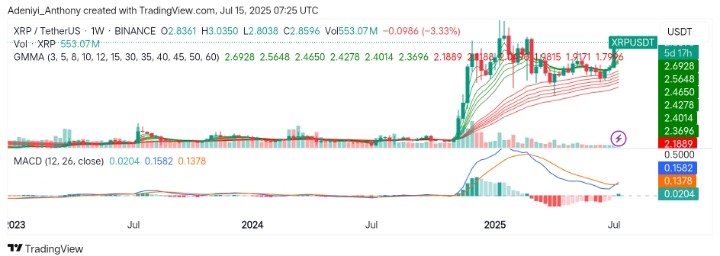
Technically, XRP against the Tether on the weekly timeframe has shown a slight tendency towards breaking out after a long period of tight range movement. However, the Guppy Multiple Moving Averages (GMMA) show bullish momentum is gaining strength as the short-period EMAs tend to the north.
From another angle, the MACD beneath the chart appears to be crossing the signal bullishly, signaling buyers are getting stronger with increasing volumes.
To this end, a clear break above $2.8880 would trigger a move towards $3.0330 in the near term. Conversely, a break below this level may signal the start of a reversal towards $2.6000.
XRPUSDT Analysis: Where from Here?
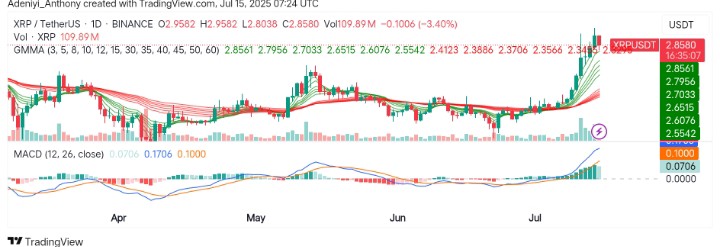
On the daily chart, XRP/USDT shows a strong bullish structure after breaking above a long period of sideways movement. However, the price is currently pulling back slightly away from the planned upside target, though the GMMA still maintains its structure.
Additionally, the MACD appears bullish, with the blue line rising steeply above the orange signal line, confirming buying pressure even with more participation. However, the price raises concern, but a move above $2.9600 would lead to a projection towards $3.0300.
You can purchase crypto coins here. Buy LBlock