Zksync (ZK/USD) Seeks Support Near the $0.12343 Level
Estimated Reading Time: 3 minutes
Don’t invest unless you’re prepared to lose all the money you invest. This is a high-risk investment and you are unlikely to be protected if something goes wrong. Take 2 minutes to learn more

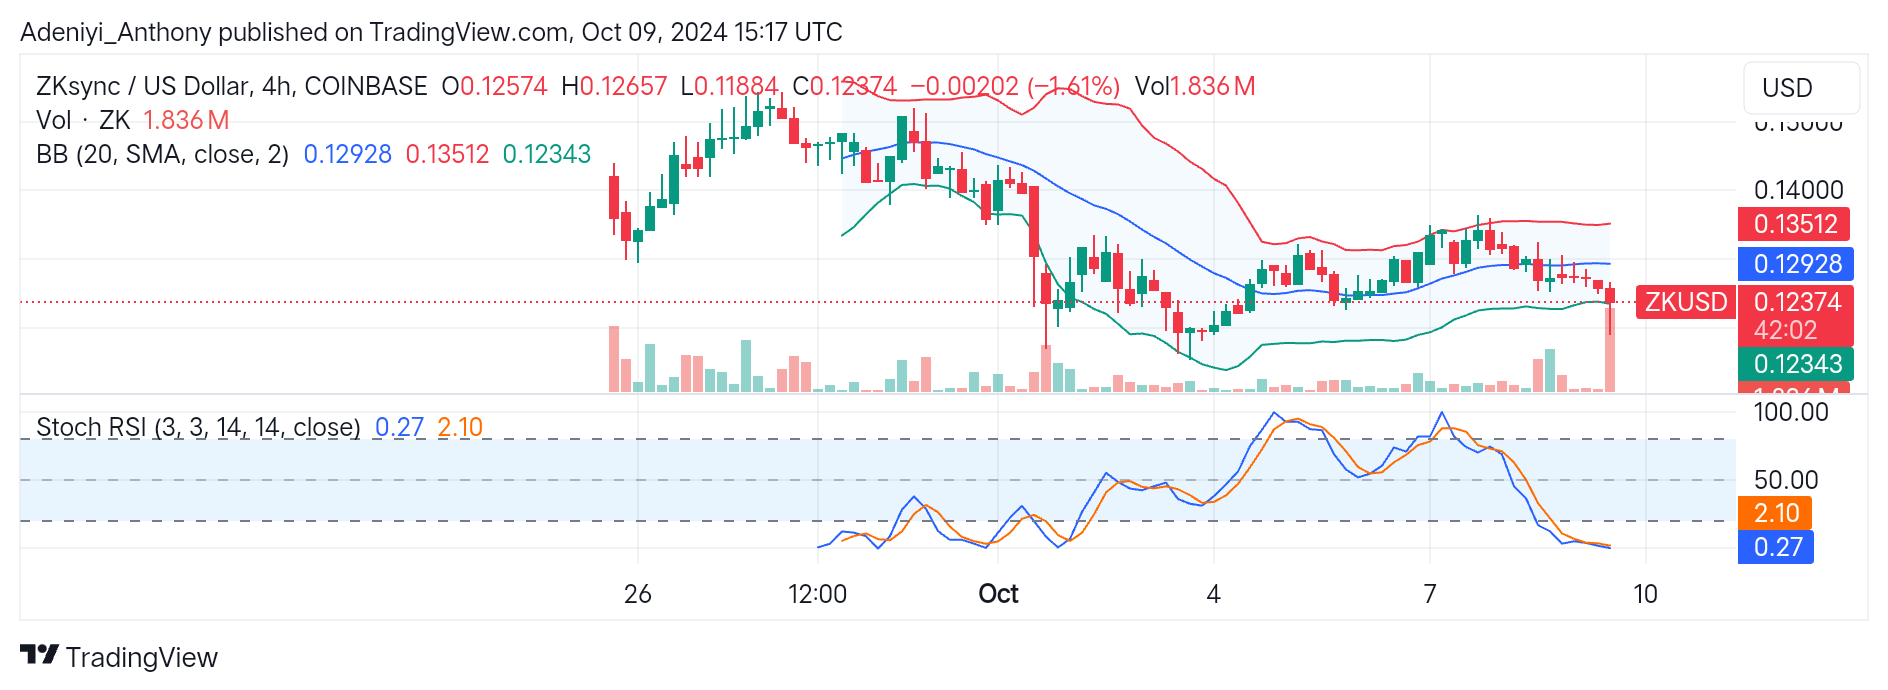
After the peak at the early listing period of October, Zksync against the United States Dollar has been on a downtrend. As depicted by the Bollinger bands on the chart, the pair has been trying to reach higher heights but has been meeting serious selling pressure.
Currently, the pair is heading towards the lower band with widened bands. This describes the activities of bearish traders in the market, as the pair now seeks support near the $0.12343 level.
The ZK/USD is trading at $0.12374 between the lower segment of the Bollinger bands with a decreased volume of 1.61% from the previous position. The sharp decline in volume coupled with the continuous sell-offs highlights the heavy presence of bearish traders.
However, the pair is currently heading towards a significant level for support, but a break below this level would translate to a further downtrend. On the contrary, if the price can be found to be strong at the $0.12343 level, a reversal to the $0.12928 middle band will be possible.
Technical Indicators
Major Resistance Levels: $0.12928, $0.13512, and $0.14000
Major Support Levels: $0.12343, $0.11884, and $0.11500
Zksync Technical Indicator Analysis
Currently, Zksync against the U.S. Dollar is on a downtrend toward a critical level. However, the Bollinger band suggests the operation of the pair between $0.12928 and $0.12343 signifies that ZK/USD is operating in the oversold zone. At this juncture, stabilization for potential reversal should be possible if bullish traders take advantage of exhausted sellers.
Also, the Stochastic Relative Strength Index (RSI) suggests bearish traders seem exhausted as the ZK/USD now operates in the deep oversold region. This indicates bullish momentum might be building up.
Zksync Trend: A Reversal or Continued Downtrend?
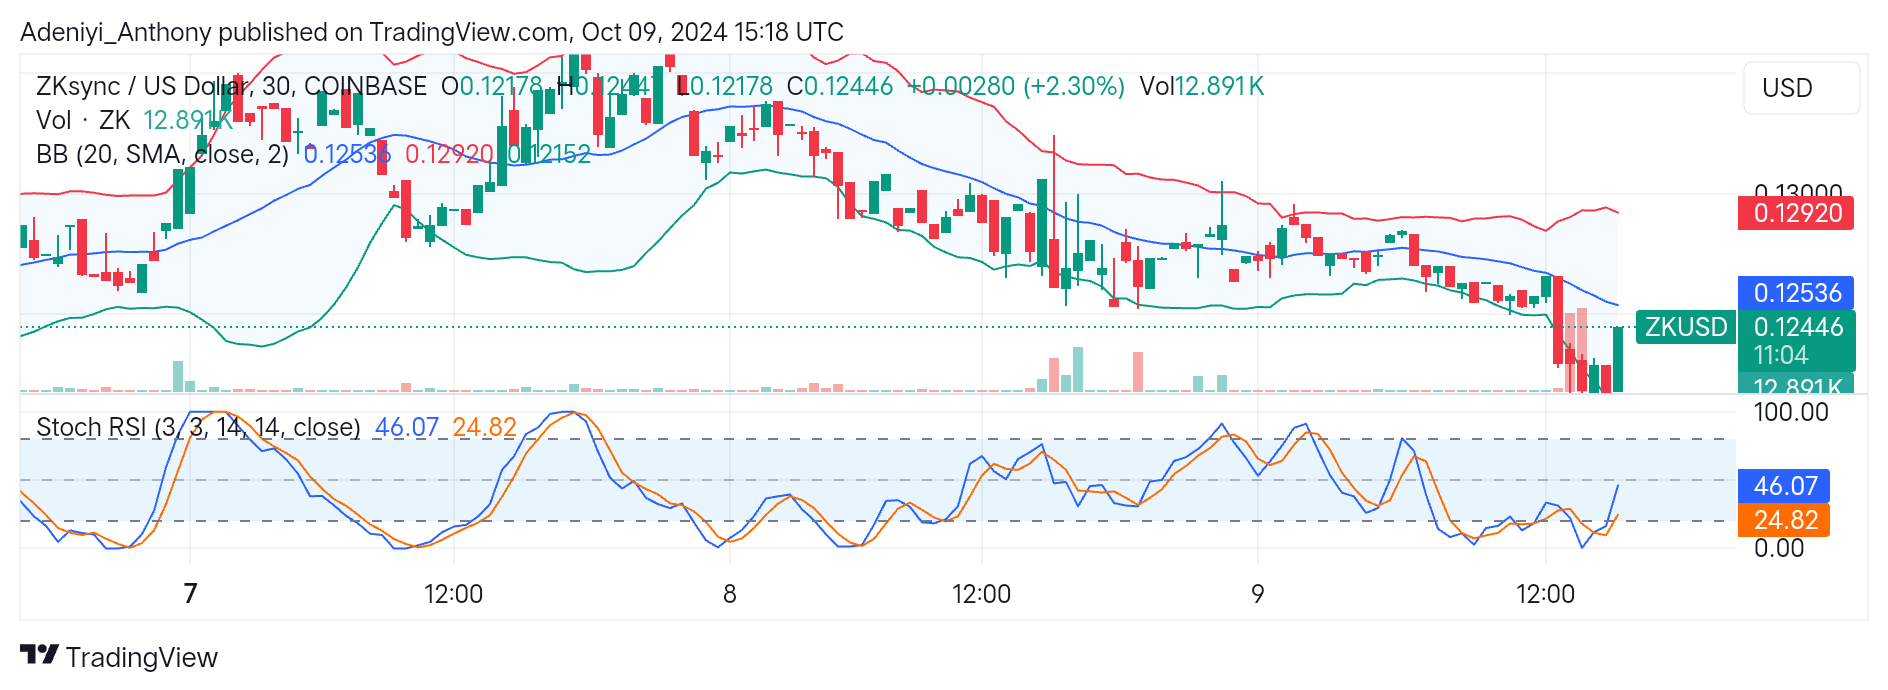
ZK/USD on the 30-minute chart has a bullish outlook, with the pair trading at $0.12446. This indicates the pair might experience a short-term upside movement after bouncing off the lower band.
Currently, the pair aims the middle band at $0.12536, the dynamic resistance level. However, the distance between the bands has not expanded enough for directional movement to be ascertained. Traders should expect more improvement to the North once the bands start widening.
The Stochastic RSI on the downside of the chart suggests the pair is heading into the free zone, which means some bullish momentum is on the horizon. However, decreased trading volume might be the only obstacle, as this suggests the current uptrend may not have a strong conviction. A short-term pullback before uptrend continuation should be expected.
You can purchase crypto coins here. Buy LBlock