UMA (UMAUSD) Is Struggling to Lift Itself Out of a Market Decline
Estimated Reading Time: 2 minutes
Don’t invest unless you’re prepared to lose all the money you invest. This is a high-risk investment and you are unlikely to be protected if something goes wrong. Take 2 minutes to learn more
UMA Analysis – Price Is Struggling to Rise After Falling to $9.000
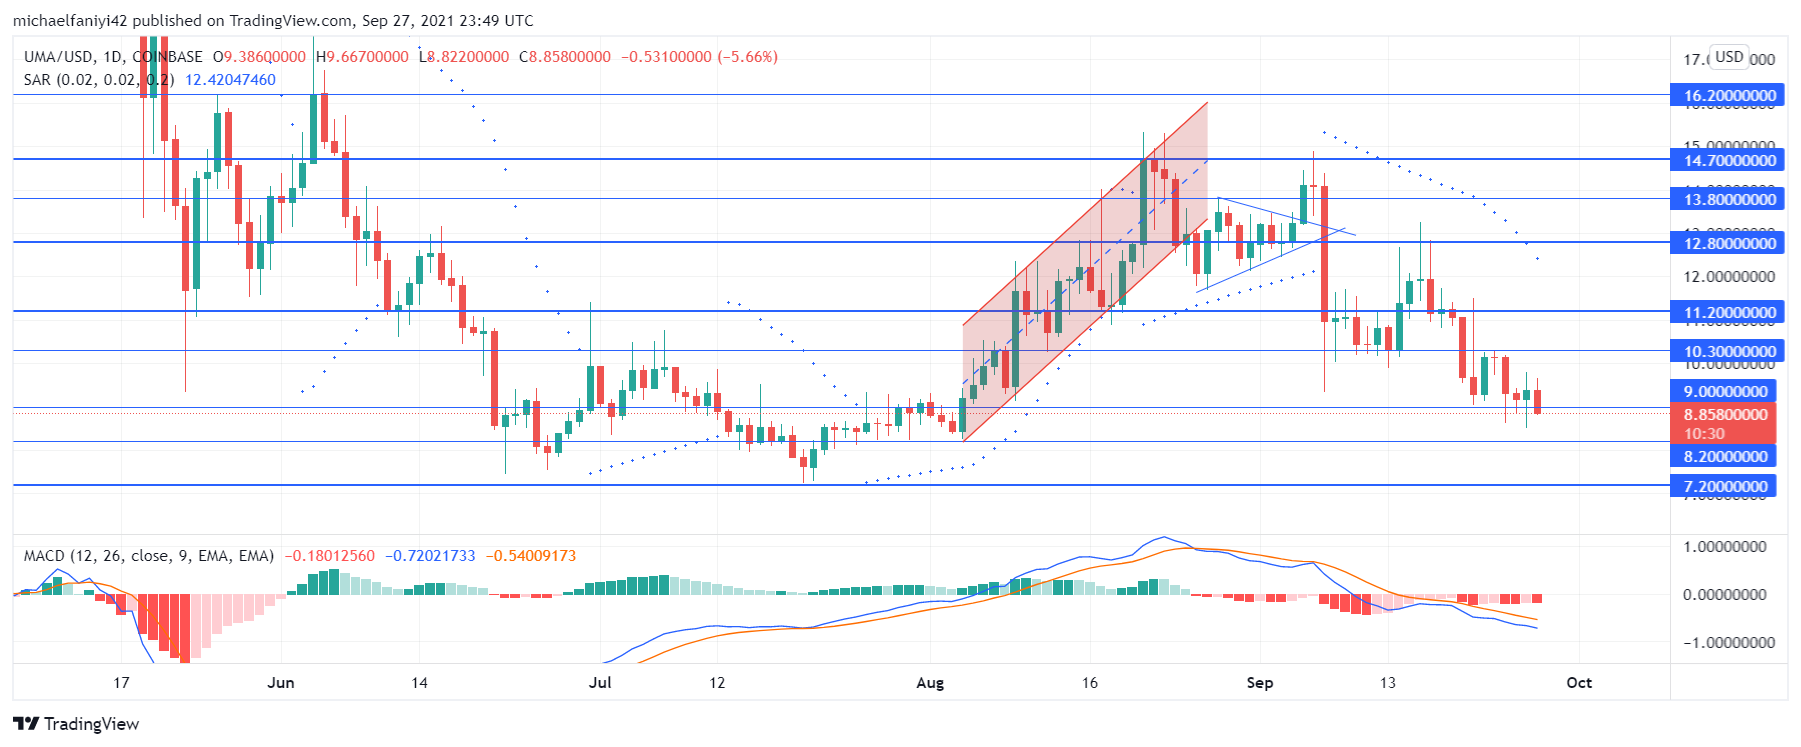
UMA is struggling to lift itself out of depression and has dropped to $9.000. Price started struggling immediately after UMA was knocked down following rejection at $14.700. It dropped to a low of $10.300, and after much travail, it climbed above $11.200, only to drop below it after only three days, to a new low of $9.000. The coin has tested the $10.300 resistance once to no effect. Hence, UMA remains confined to the $9.000 range.
UMA Important Levels
Resistance Levels: $10.300, $11.200, $12.800
Support Levels: $9.000, $8.200, $7.200
The coin is now in a similar position to what it was earlier in the year, around the 19th of June 2021. The market plummeted from $18.000, but it found its major support at the $11.200 key level. But the price then dropped to $9.000, and not long after it fell further to rock bottom around $7.200. It was only when the price got here that it started making more telling and successful moves upward.
The market is now also facing the possibility of a plunge to $7.200. The MACD (Moving Average Convergence Divergence) has its lines plunging below the zero level. The histogram bars are red and bearish and have since been displayed with varying intensity. The MA period 20 (Moving Average) is now lying above the daily candles to push it down further.

Market Expectations
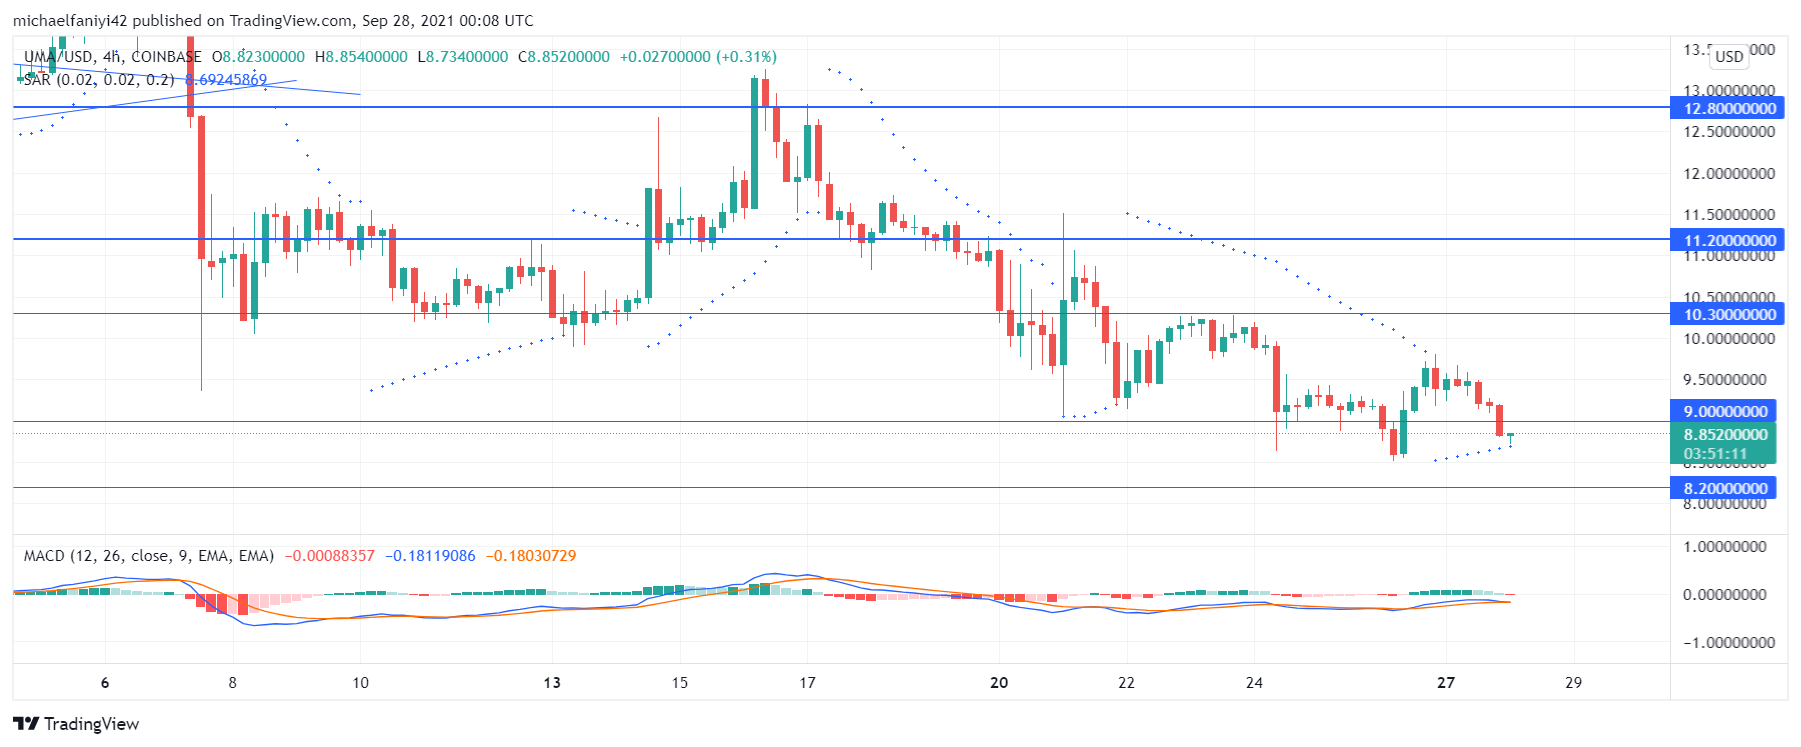
On the 4-hour chart, a consistent drop in price is visible, characterized by lower lows and lower highs. The Moving Average period 20 is acting like a trend line to conduct price downward. Meanwhile, the MACD lines are continuously undulating below the zero line. The lines seem to be coming up despite the fall in the candles.
In summary, the price is very likely to drop lower to $8.200.
You can purchase crypto coins here: Buy Tokens
Note: Cryptosignals.org is not a financial advisor. Do your research before investing your funds in any financial asset or presented product or event. We are not responsible for your investing results.