Polkadot Declines as It Revisits the Previous Low at $5.98
Estimated Reading Time: 2 minutes
Don’t invest unless you’re prepared to lose all the money you invest. This is a high-risk investment and you are unlikely to be protected if something goes wrong. Take 2 minutes to learn more

Free Crypto Signals Channel
Polkadot (DOT) Long-Term Analysis: Bearish
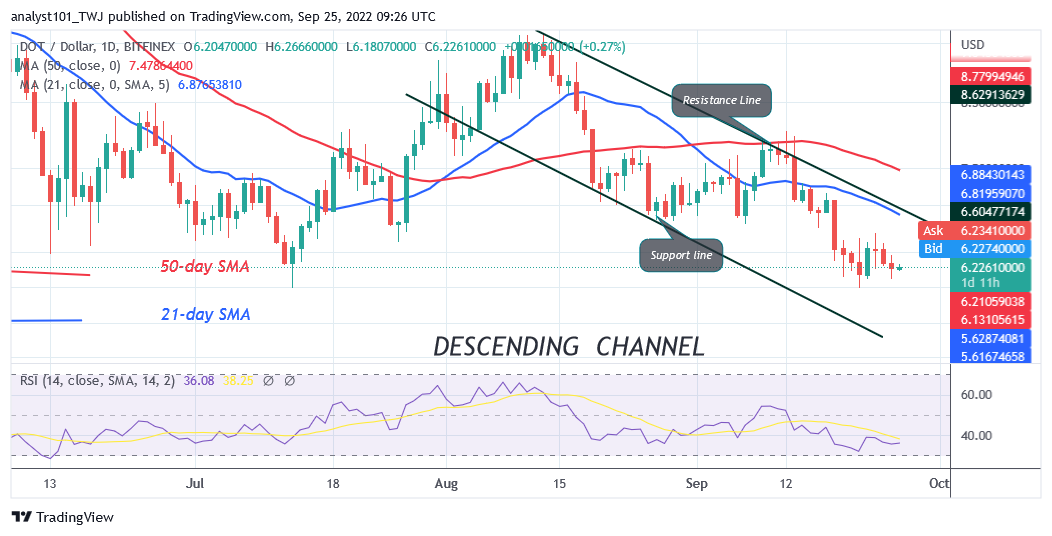
Polkadot’s (DOT) price is in a downtrend as it revisits the previous low at $5.98. On July 13, the altcoin declined to the low of $5.98 and rebounded. DOT price rallied to the high of $9.64 on August 10. Today, the cryptocurrency has declined to the previous low at $5.98. On the downside, if sellers breach the $6.00 support, the altcoin will decline to $4.00 low. However, Polkadot will resume an uptrend if the current support holds. Since July 13, the bulls have been defending the current support, and the market is said to be in the oversold region. On the upside, if Polkadot rebounds above the $6.00 support, it will rise and break the 21-day line SMA. This will give buyers another chance to push the altcoin to the previous highs.
Polkadot (DOT) Indicator Analysis
Polkadot is at level 39 of the Relative Strength Index for period 14. The crypto is in the downtrend zone and has reached the oversold region. The price bars are below the moving average lines which indicates further decline. Polkadot is below the 20% range of the daily Stochastic. It implies that further selling pressure is unlikely.
Technical indicators:
Major Resistance Levels – $10, $12, $14
Major Support Levels – $8, $6, $4
What Is the Next Direction for Polkadot (DOT)?
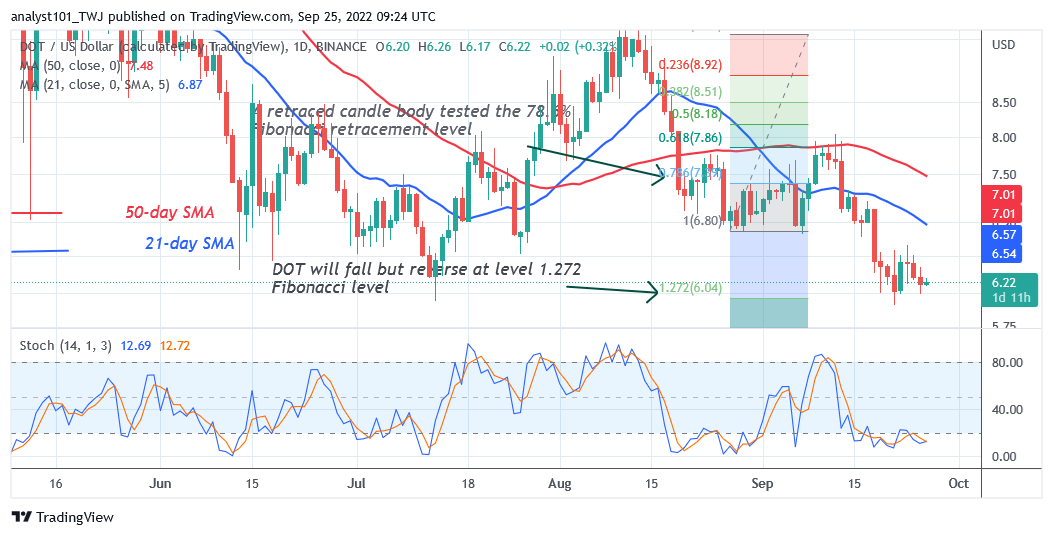
The cryptocurrency has fallen to the oversold region as it revisits the previous low at $5.98. Buyers will emerge to take control of prices. The downtrend has reached bearish exhaustion. Meanwhile, on the August 27 downtrend; a retraced candle body tested the 78.6% Fibonacci retracement level. The retracement suggests that DOT will fall but reverse at level 1.272 Fibonacci level or $6.04.
You can purchase crypto coins here. Buy LBLOCK
Note: Cryptosignals.org is not a 1a financial advisor. Do your research before investing your funds in any financial asset or presented product or event. We are not responsible for your investing results