Polkadot (DOT) Makes Higher Highs and Higher Lows, Targets $52 High
Estimated Reading Time: 2 minutes
Don’t invest unless you’re prepared to lose all the money you invest. This is a high-risk investment and you are unlikely to be protected if something goes wrong. Take 2 minutes to learn more

Polkadot (DOT) Long-Term Analysis: Bullish
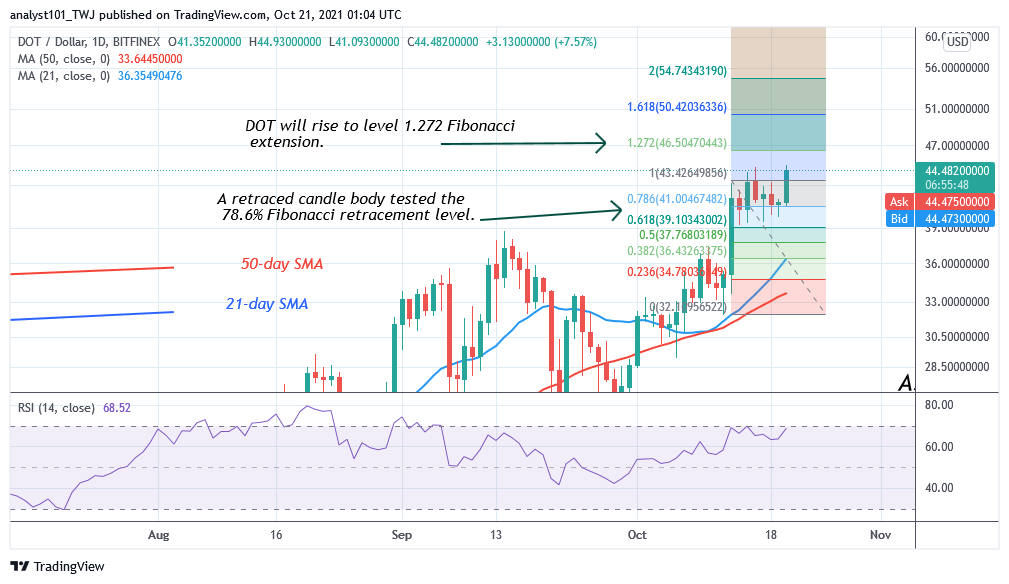
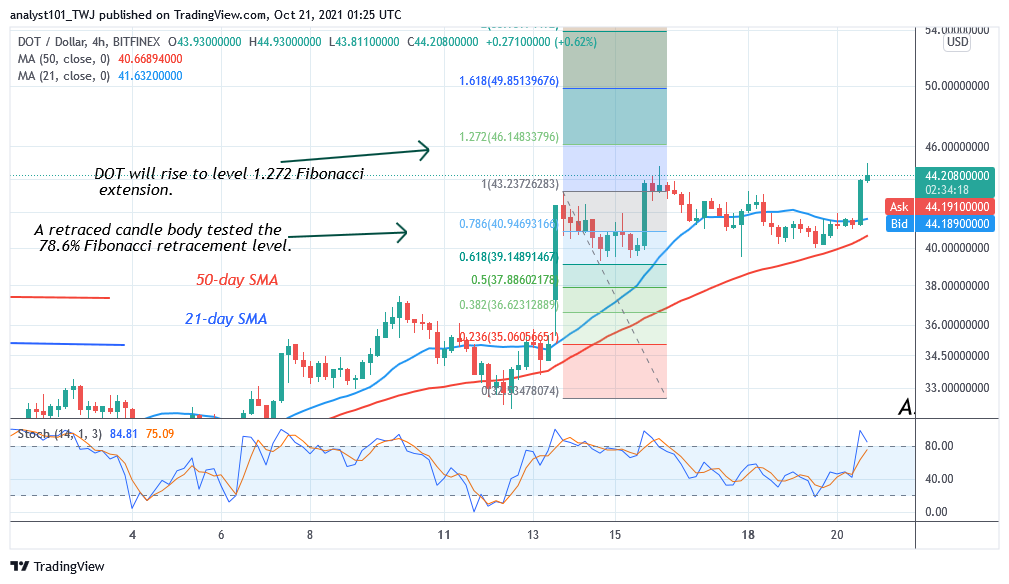
Yesterday, Polkadot’s (DOT) price has made positive moves as the market reaches the high of $44. Since September 29, DOT price has been making higher highs and higher lows. Meanwhile, on the October 13 uptrend, a retraced candle body tested the 78.6% Fibonacci retracement level. The retracement indicates that DOT will rise but reverse at level 1.272 Fibonacci extension or $46.50.
Polkadot (DOT) Indicator Analysis
Presently, Polkadot is at level 68 of the Relative Strength Index period 14. This indicates that DOT price is in an uptrend zone but approaches the overbought region. The cryptocurrency is above 80% area of the daily stochastic. It indicates that the coin is in the overbought region of the market. The 21-day line and the 50-day line moving averages are pointing northwards. The crypto may reach overbought region of the market.
Technical indicators:
Major Resistance Levels – $48, $52, $56
Major Support Levels – $32, $28, $24
What Is the Next Direction for Polkadot (DOT)?
On the 4 –hour chart, Polkadot is in an uptrend. On October 13, the price rebounded above the 21-day line moving average as the altcoin resumes upward. Meanwhile, on the October 13 uptrend, a retraced candle body tested the 78.6% Fibonacci retracement level. The retracement indicates that DOT will rise but reverse at level 1.272 Fibonacci extension or $46.14. From the action, the altcoin has reached the targeted price level.
You can purchase crypto coins here. Buy Tokens
Note: Cryptosignals.org is not a financial advisor. Do your research before investing your funds in any financial asset or presented product or event. We are not responsible for your investing results