Ethereum (ETH) Rallies to an Overbought Region, Retraces to $2,900 Support
Estimated Reading Time: 2 minutes
Don’t invest unless you’re prepared to lose all the money you invest. This is a high-risk investment and you are unlikely to be protected if something goes wrong. Take 2 minutes to learn more

Ethereum Price Long-Term Analysis: Bearish
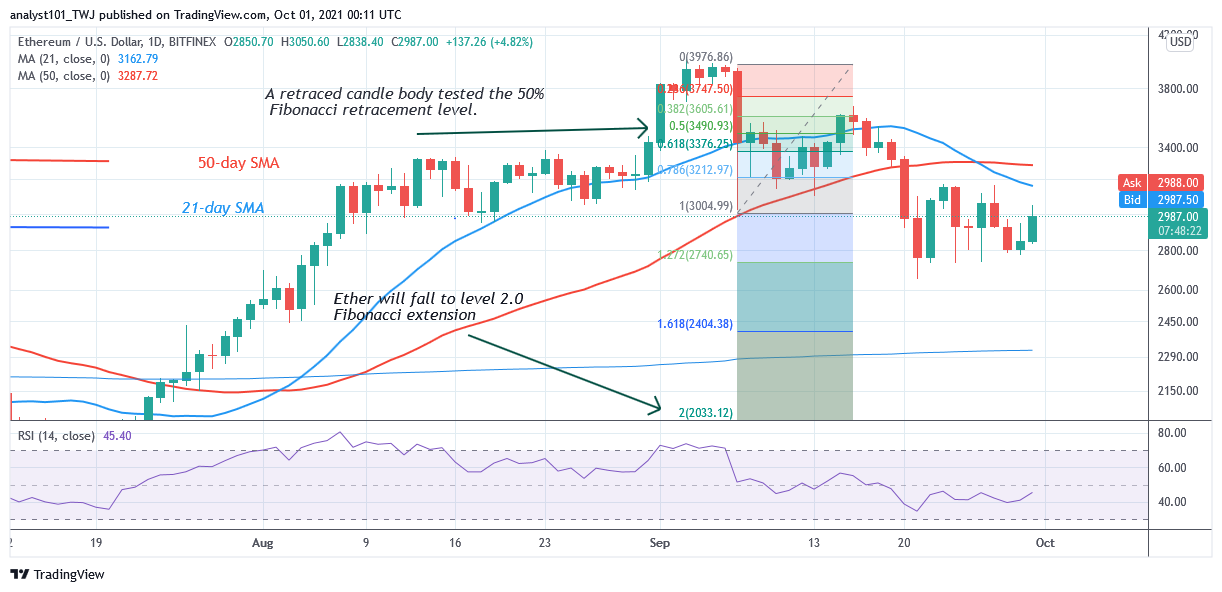
Ethereum (ETH) price is in a range-bound move above the $2,760 support. After September 21 bearish impulse, the market declined to $2,656 low and resumed a sideways move. For the past week, the biggest altcoin has been fluctuating between $2,760 and $3,200 price levels. Today, buyers push the altcoin to $3,036 high but were repelled. This has been the price action for the past week. The range-bound levels are yet to be broken. Meanwhile, on September 7 downtrend; a retraced candle body tested the 50% Fibonacci retracement level. The retracement indicates that Ether will fall to level 2.0 Fibonacci extension or level $2,033.12.
Ethereum Indicator Analysis
The 21-day SMA crosses below the 50-day SMA indicating a sell signal. The altcoin is at level 45 of the Relative Strength Index period 14. It indicates that the market is in the downtrend zone and capable of falling on the downside. Ether is below the 80% range of the daily stochastic. The market is in a bearish momentum.
Technical indicators:
Major Resistance Levels – $2, 600, $2,800, $3,000
Major Support Levels – $1.500, $1, 300, $1,100
What Is the Next Direction for Ethereum?
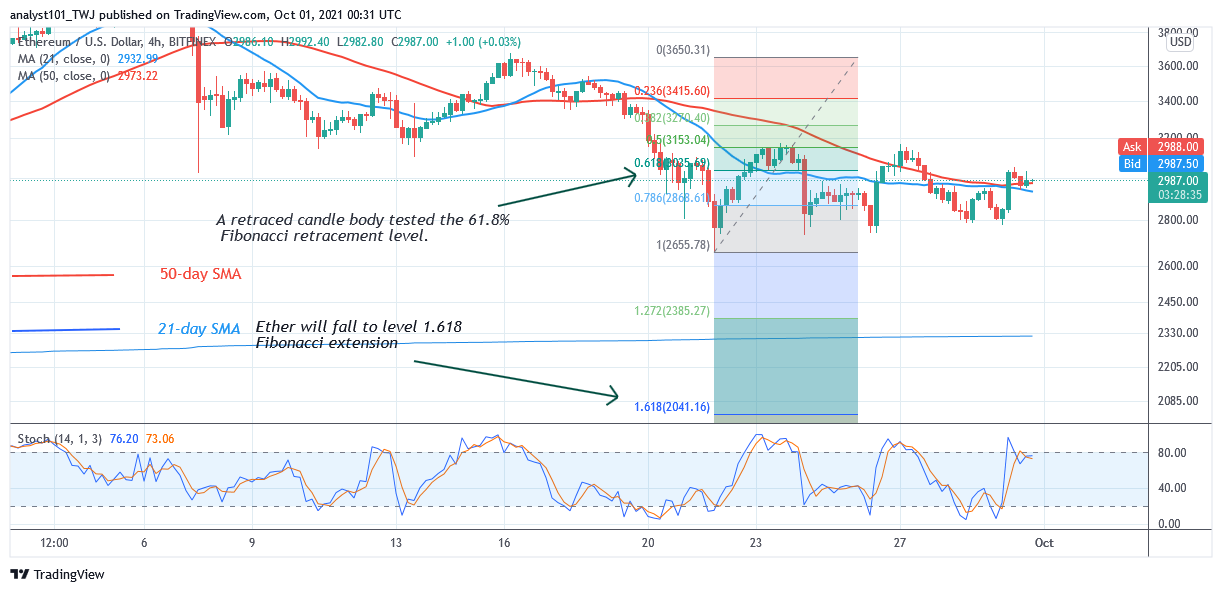
On the 4- hour chart, Ether is in a range-bound move. The bearish trend has subsided as the altcoin resumed a sideways move. Today, Ether is retracing after the resistance at the recent high. Meanwhile, on September 21 downtrend; a retraced candle body tested the 61.8% Fibonacci retracement level. The retracement indicates that Ether will fall to level 1.618 Fibonacci extension or level $2,041.16.
You can purchase crypto coins here. Buy Tokens
Note: Cryptosignals.org is not a financial advisor. Do your research before investing your funds in any financial asset or presented product or event. We are not responsible for your investing results