Ethereum (ETH/USD) Market Extends to a New All-time Valuation
Estimated Reading Time: 3 minutes
Don’t invest unless you’re prepared to lose all the money you invest. This is a high-risk investment and you are unlikely to be protected if something goes wrong. Take 2 minutes to learn more
Ethereum Price Prediction – November 8
It is now on record that the ETH/USD market extends to a new all-time valuation as the crypto-economic price bags a positive percentage rate of about 2.28. The market witnesses a trading volume of around $4,720 as of writing.
ETH/USD Market
Key Levels:
Resistance levels: $5,000, $5,250, $5,500
Support levels: $4,250, $4,000, $3,750
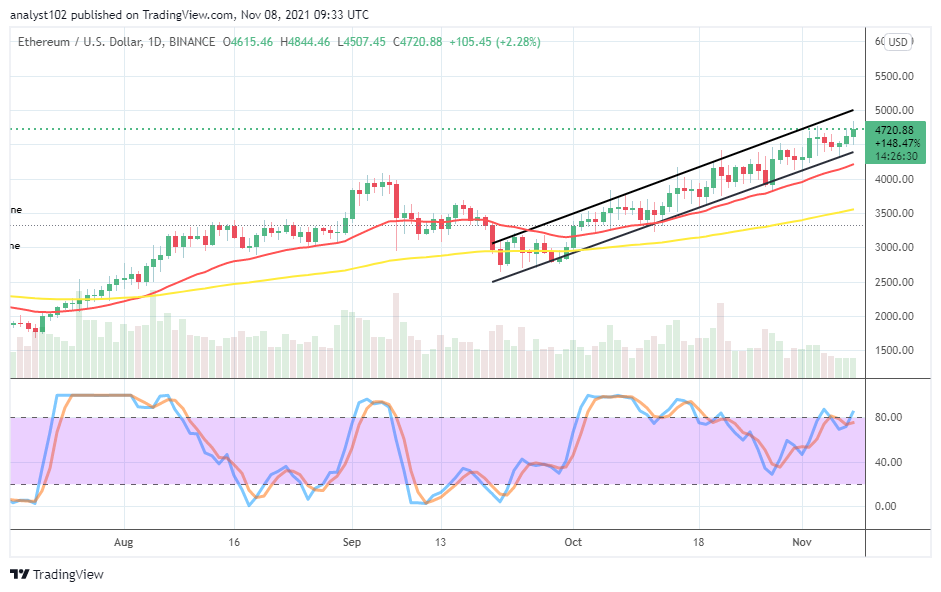
ETH/USD – Daily Chart
The ETH/USD daily chart reveals that the crypto market extends to a new all-time valuation as it recorded about $4,844 higher value-line during today’s ongoing northward motions. The bullish channel trend lines drew in an extension above the trend lines of the SMAs. The 14-day SMA indicator is above the 50-day SMA indicator. The Stochastic Oscillators are found around the range of 80, swinging the lines into the overbought region. That signifies the possibility that the market may soon relax in its momentum to the upside.
Can there be a further push off the resistance level at $5,000 as the market extends to a new all-time valuation?
Technically, it is expected that the ETH/USD economic price will encounter a resistance below or around $5,000 resistance level as the market extends to a new all-time valuation. As a result, it would be psychologically ideal buyers exercise some degrees of wariness in their re-positioning to launch further long positions around that trading zone earlier mentioned.
On the downside, the ETH/USD market sellers may now have to get re-positioned around the $5,000 resistance level. Lower trading charts of 1-hour and 4-hour can be instrumental to timely observe the near probability of getting a price retracement at a higher peak point of the market. Traders are required to back up their sell position entries with active price action.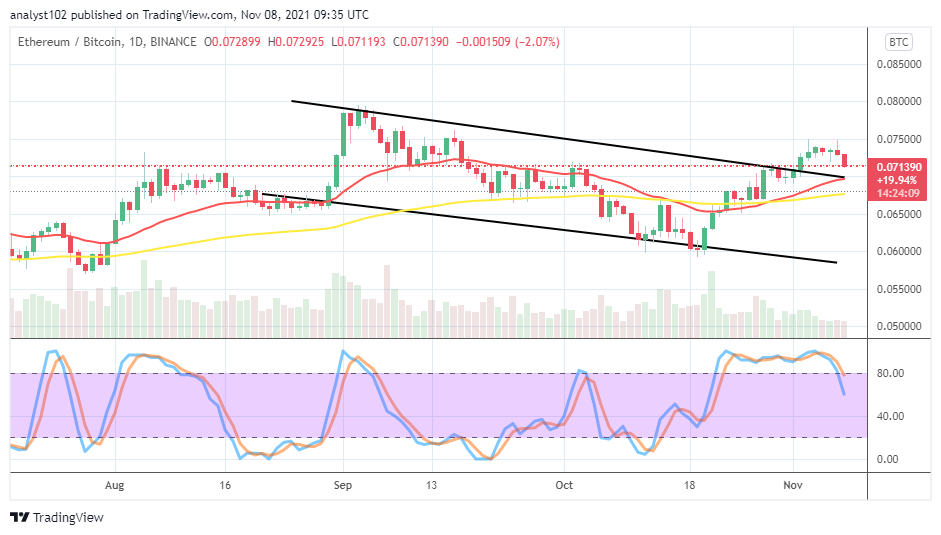
ETH/BTC Price Analysis
In comparison, Ethereum’s trending capacity seems to have reached a significant psychological resistance zone as paired with Bitcoin. The cryptocurrency pair market extends to a higher value-line above the SMA trend lines. And, the duo-cryptos price currently embarks upon a retracement course. The 50-day SMA indicator is underneath the 14-day SMA indicator, separated by a smaller space. The Stochastic Oscillators have crossed the lines southbound against the range of 80. That indicates that the base crypto has begun to lose some momentums to the flagship counter trading instrument in the crypto-economic trading arena.
Note: Cryptosignals.org is not a financial advisor. Do your research before investing your funds in any financial asset or presented product or event. We are not responsible for your investing results.
You can purchase crypto coins here. Buy Tokens