Ethereum Is in a Bear Trap as Bulls Buy the Dips at $1,013
Estimated Reading Time: 2 minutes
Don’t invest unless you’re prepared to lose all the money you invest. This is a high-risk investment and you are unlikely to be protected if something goes wrong. Take 2 minutes to learn more

Free Crypto Signals Channel
Ethereum Price Long-Term Analysis: Bearish
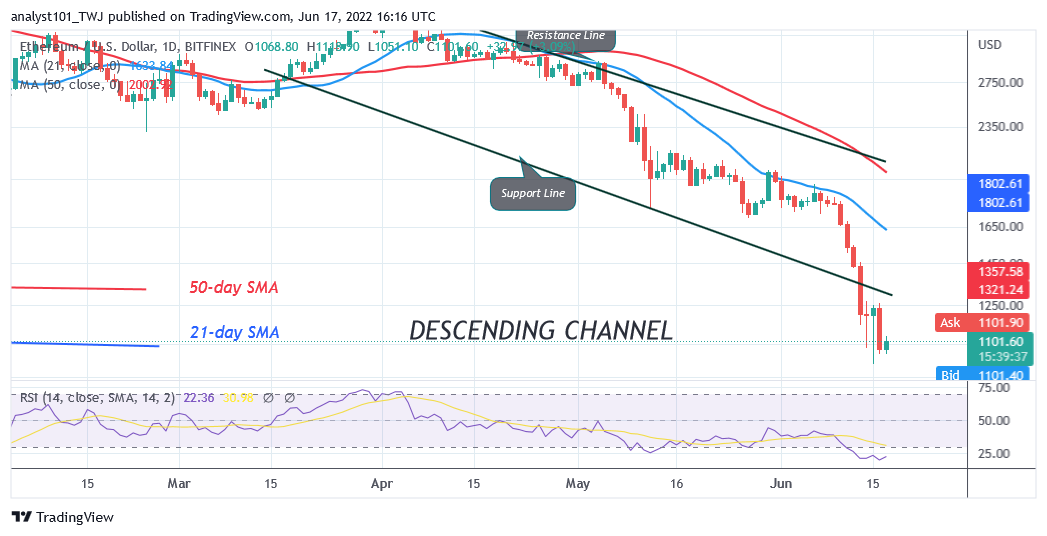
Ethereum’s (ETH) price is in a downward correction as bulls buy the dips at $1,013 . Buyers are battling to defend the $1,000 crucial support. The bottom line is that there will be panic buying and selling if Ether loses the $1,000 support. In the meantime, Ether has been fluctuating between $1,000 and $1,250 price levels. The largest altcoin will rally to the high of $1,520 if buyers overcome the resistance at $1,250. In the meantime, ETH/USD is falling as it reaches the low of $1,076 at the time of writing.
Ethereum Indicator Analysis
Ether is at level 20 of the Relative Strength Index for period 14. The altcoin is trading in the oversold region of the market as buyers are expected to emerge. The crypto’s price bars are far below the moving averages indicating a further decline. The crypto is below the 20% range of the daily stochastic. The market is in bearish momentum.
Technical indicators:
Major Resistance Levels – $2, 600, $2,800, $3,000
Major Support Levels – $1.500, $1, 300, $1,100
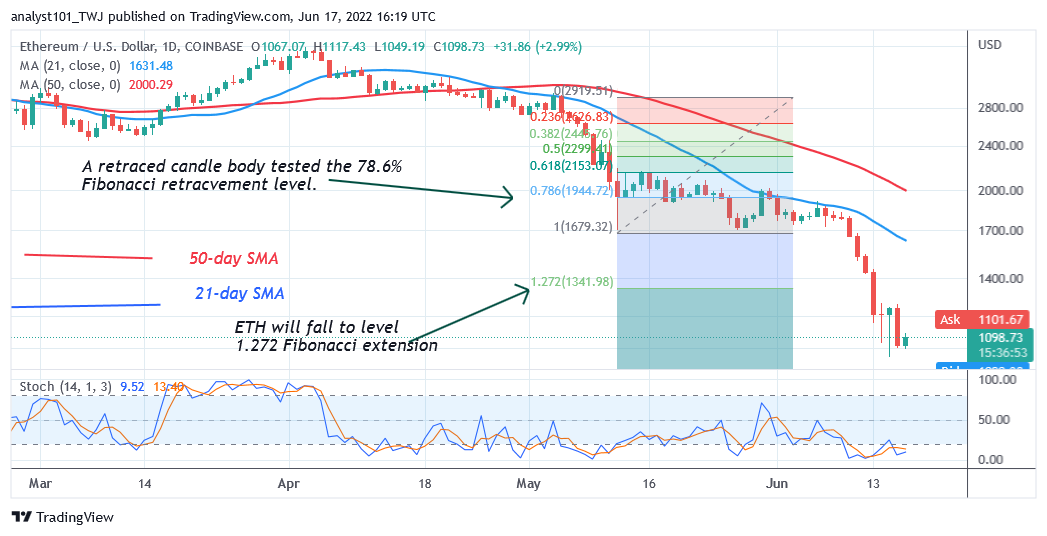
What Is the Next Direction for Ethereum
Ethereum is fluctuating above the $1000 support as bulls buy the dips at $1,013 . Meanwhile, on May 12 downtrend; a retraced candle body tested the 78.6% Fibonacci retracement level. The retracement indicates that ETH will fall to level 1.272 Fibonacci extension or $1,341.98. From, the price action, Ether has fallen to the low of $1,092.
You can crypto coins here. Buy LBlock
Note: Cryptosignals.org is not a financial advisor. Do your research before investing your funds in any financial asset or presented product or event. We are not responsible for your investing results