Ethereum Trades in a Tight Range as It May Decline Below the $1,560 Low
Estimated Reading Time: 3 minutes
Don’t invest unless you’re prepared to lose all the money you invest. This is a high-risk investment and you are unlikely to be protected if something goes wrong. Take 2 minutes to learn more

Free Crypto Signals Channel
Ethereum Price Long-Term Analysis: Bullish
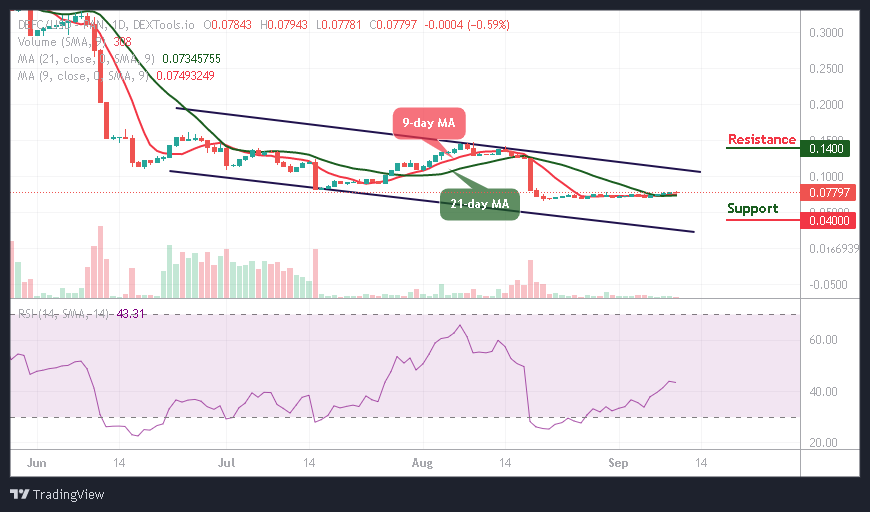
Since July 28, Ethereum has been trading below the $1,785 resistance zone as it may decline below the $1,560 low. In the same vein, the market has been fluctuating between $1,560 and $1,785 price levels. The price movement has been insignificant because of the presence of indecisive small body candlesticks called Doji and Spinning tops. The uptrend has been hindered because Ether is trading in the overbought region of the market. Buyers will push Ether above the resistance at $1,700 and $1,785 if the altcoin rebounds above the current support. The bullish momentum will extend to the high of $2,013. On the other hand, if the bulls fail to break the resistance at $1,785, Ether will decline and continue the range-bound movement.
Ethereum Indicator Analysis
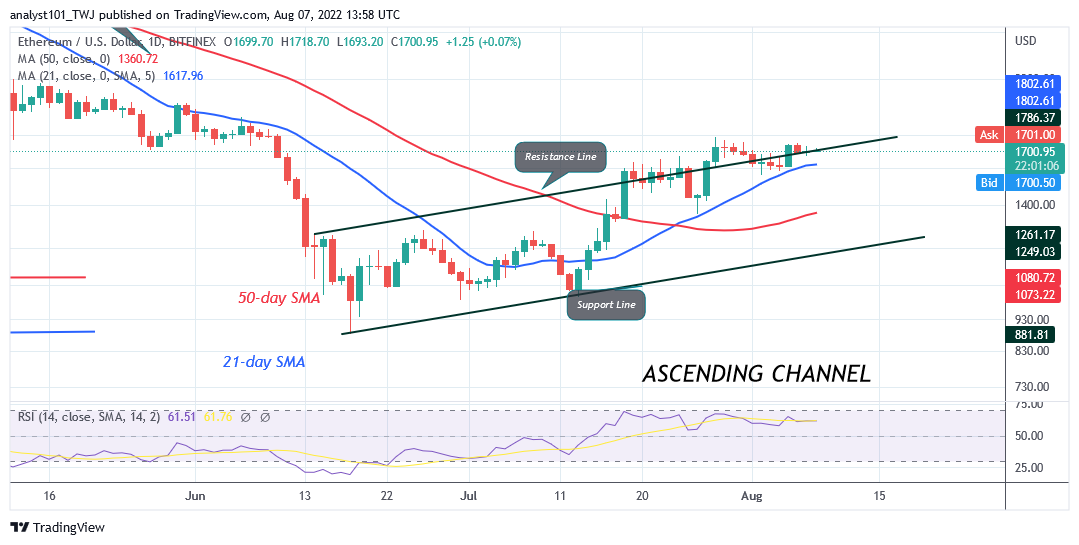
Ether is at level 63 of the Relative Strength Index for period 14. The crypto is in the bullish trend zone but failed to break the recent high. The price bars are above the moving average lines indicating a further upward move. The altcoin is above the 80% range of the daily stochastic. It indicates that the market is overbought. Sellers will push prices to the previous lows. The 21-day SMA and 50-day SMA are sloping upward indicating the uptrend.
Technical indicators:
Major Resistance Levels – $2, 600, $2,800, $3,000
Major Support Levels – $1.500, $1, 300, $1,100
What Is the Next Direction for Ethereum?
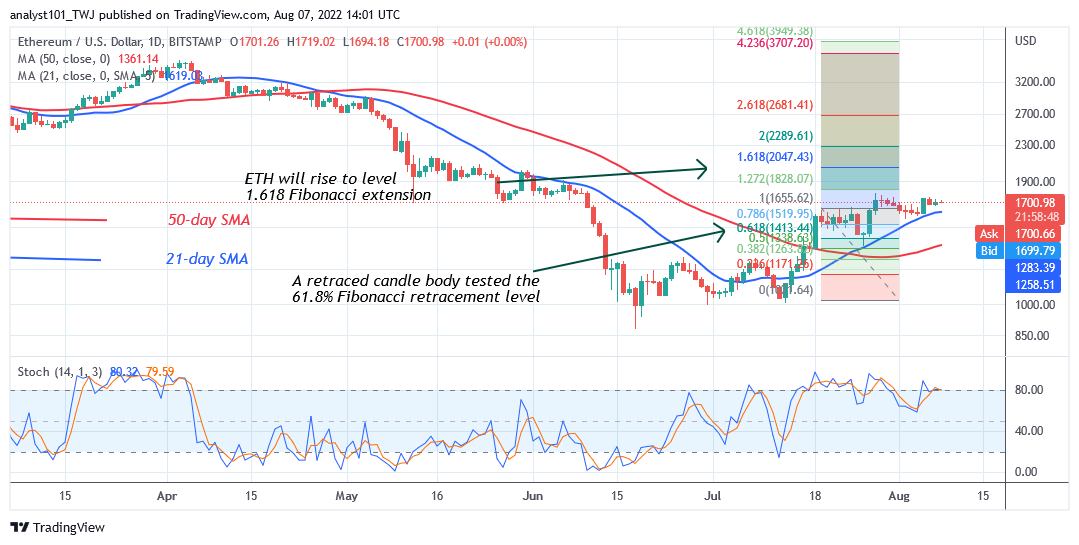
ETH/USD is in a sideways move as it may decline below the $1,560 low. The altcoin may rebound or decline to the previous price levels. Meanwhile, on July 19 uptrend, a retraced candle body tested the 50% Fibonacci retracement level. The retracement suggests that ETH will rise to level 2.0 Fibonacci extension or $2,047..43.
You can crypto coins here. Buy LBlock
Note: Cryptosignals.org is not a financial advisor. Do your research before investing your funds in any financial asset or presented product or event. We are not responsible for your investing results