Ethereum Renews Bullish Ascent as Analysts Cite Similarities with 2017 Bull Rally
Estimated Reading Time: 3 minutes
Don’t invest unless you’re prepared to lose all the money you invest. This is a high-risk investment and you are unlikely to be protected if something goes wrong. Take 2 minutes to learn more

With a current market cap of over $558 billion, Ethereum (ETH) has performed exceptionally well in 2021, following its +525% year-to-date increase. While many other altcoins have recorded higher YTD growths, Ethereum steals the cake in terms of stability.
That said, with only seven weeks left in 2021, experts expect to see Ethereum’s YTD numbers spike to a jaw-dropping 2,000%. This prediction could come to pass if ETH replicates the trend from 2017 around this same period.
Many analysts have described 2021 as the “second coming” of 2017’s bull run. We have seen numerous record highs establishments and some peculiar price similarities between both bullish years. To start with, Ethereum printed new record highs of $420 and $4,384 in Q2 2017 and Q2 2021, respectively. And like clockwork, the largest altcoin has recorded new ATH above the previous levels in Q4 2017 and Q4 2021, in November.
When analysts juxtapose both charts, a fractal pattern emerges between 2017 and 2021. If these projections are correct, ETH is on the verge of a whopping 253% breakout. In 2017, the bullish surge drove Ethereum’s price to $1,420. A repetition of the 253% jump should see ETH’s value surge towards the $16,000 mark by the third week of December.
In such a scenario, the second-largest cryptocurrency’s market capitalization would cross the $1.5 trillion mark.
Key Ethereum Levels to Watch — November 15
Following a steady correction to the $4,520 low (base of my seven-week-long ascending channel), ETH appears to have gained some upward mobility as it breaks above the $4,700 barrier.
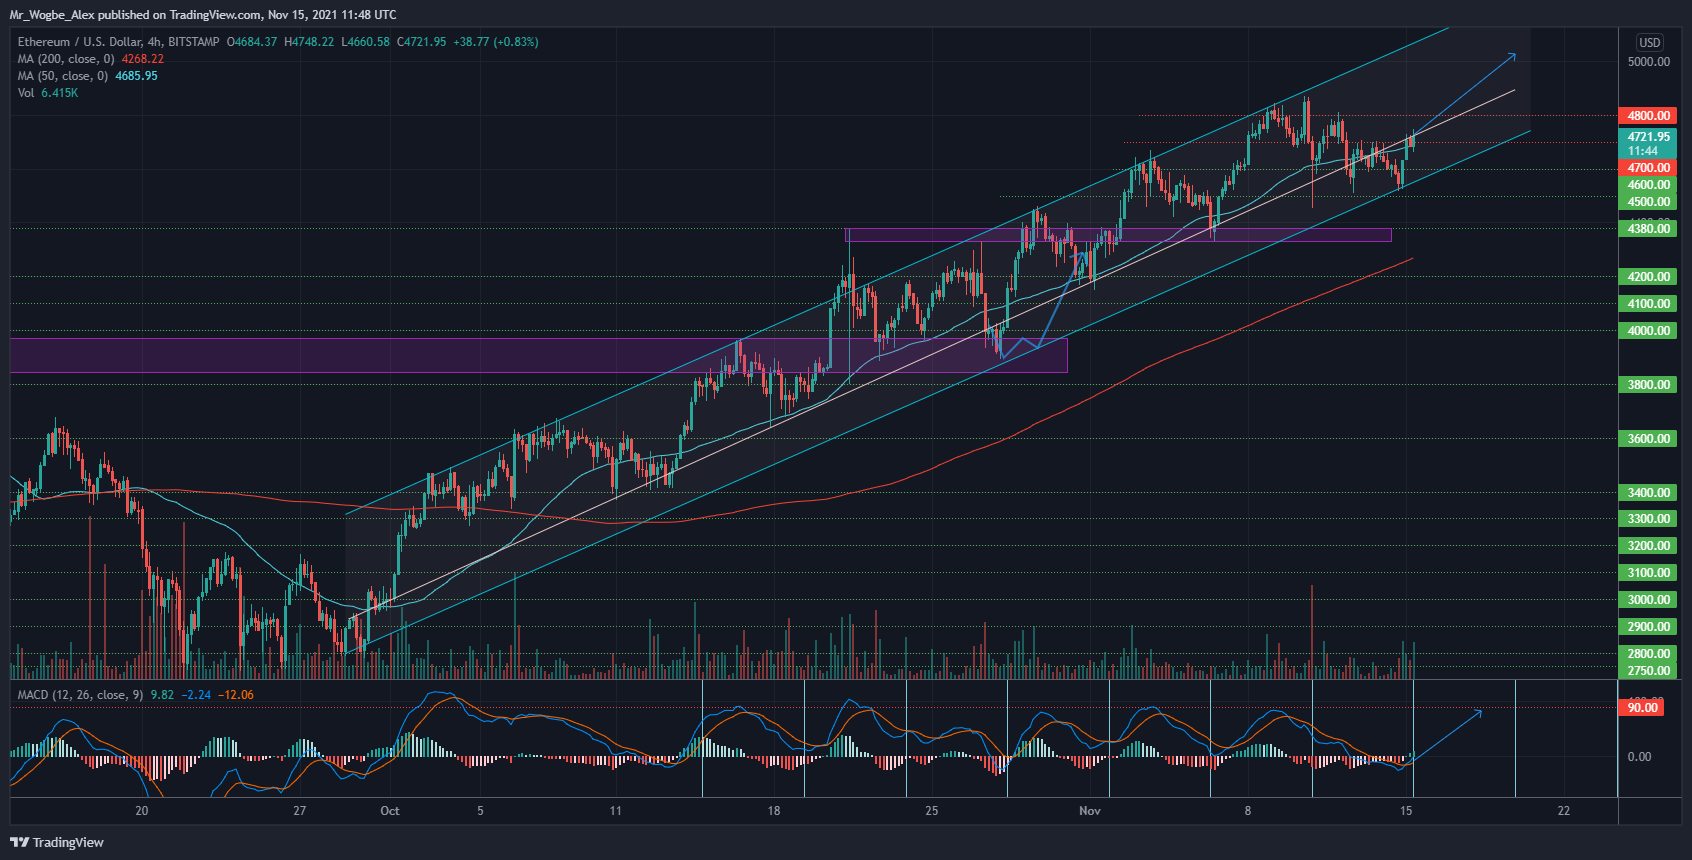
That said, the behemoth cryptocurrency needs a break above my prevailing trendline at the $4,740 level. A successful close above this line should open the doors for a possible $5,000 price tag for Ethereum in the coming days and weeks.
Interestingly, my 4-hour MACD indicator shows that a new bullish cycle is afoot, as trading conditions emerge from bearish conditions.
Meanwhile, my resistance levels are $4,750, $4,800, and $4,900, and my support levels are $4,600, $4,500, and $4,380.
Total Market Capitalization: $2.87 trillion
Ethereum Market Capitalization: $558 billion
Ethereum Dominance: 19.4%
Market Rank: #2