Litecoin (LTC) Price Prediction: LTC/USDT Breaches the $60 Baseline
Estimated Reading Time: 2 minutes
Don’t invest unless you’re prepared to lose all the money you invest. This is a high-risk investment and you are unlikely to be protected if something goes wrong. Take 2 minutes to learn more

Date: February 3, 2026
The crypto market was shaken as Bitcoin’s price collapsed below the $80,000 baseline. This development also influenced the Litecoin market, sending its price action crashing through the $60 level. More details about the market are outlined below.
LTC/USDT Long-Term Trend — Bearish (Daily Chart)
Key Price Levels
Resistance: $65, $70, $75
Support: $55, $50, $45
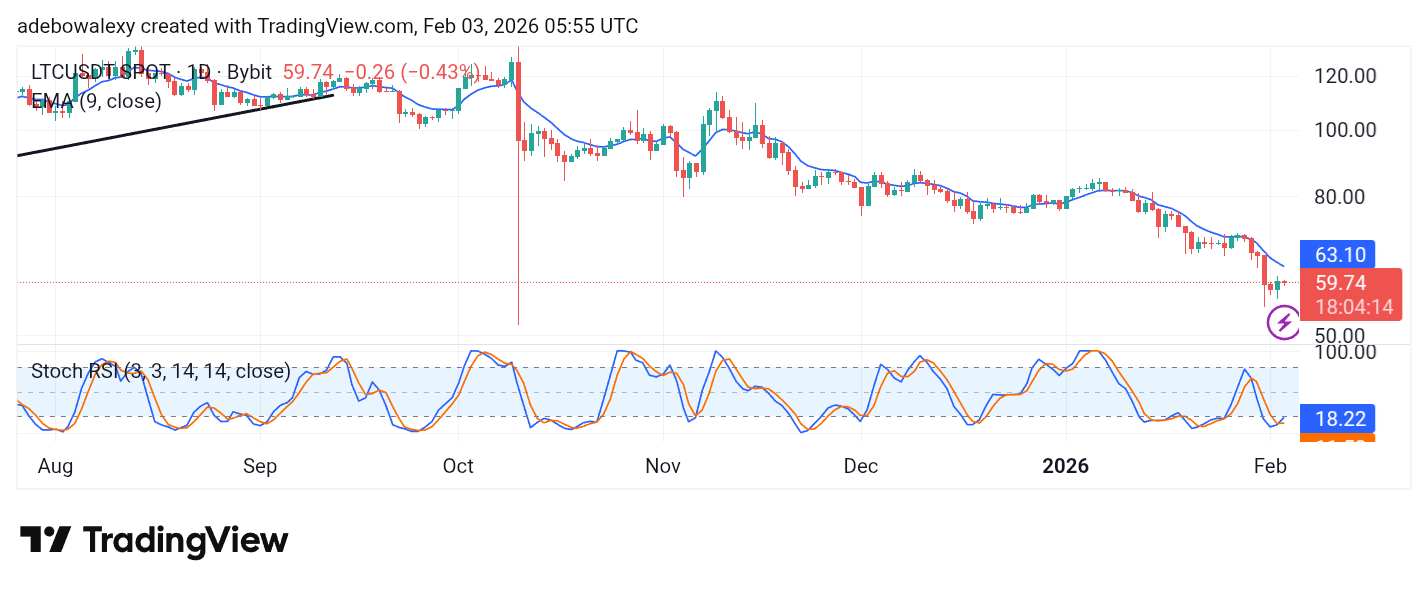
The Litecoin market edged lower over the previous session. Currently, the token trades below the 9-day Exponential Moving Average (EMA) line. The ongoing session is represented by a small red price candle. Even so, the market still stands slightly above the base of the previous session. Meanwhile, the Stochastic Relative Strength Index (SRSI) indicator lines maintain an upward bias following an upside crossover in the oversold region.
Litecoin (LTC) Price Prediction: LTC/USDT May Be Yielding Bearish Pressure Already
Observing the daily chart, downward forces appear to be prevailing in the ongoing session. The latest price candle is red and has formed below the 9-day EMA curve. This move followed a brief pullback attempt by the bulls.
However, bearish activity remains limited, and as a result, the SRSI indicator lines remain tilted upward. Nonetheless, the fact that price action remains below the 9-day EMA curve continues to threaten bullish prospects.
Litecoin (LTC) Price Prediction: LTC/USDT Crawls Sideways Above the EMA (4-Hour Chart)
The Litecoin 4-hour chart indicates that bearish pressure is still present. The most recent price candles are bearish but remain just above the 9-day EMA line.
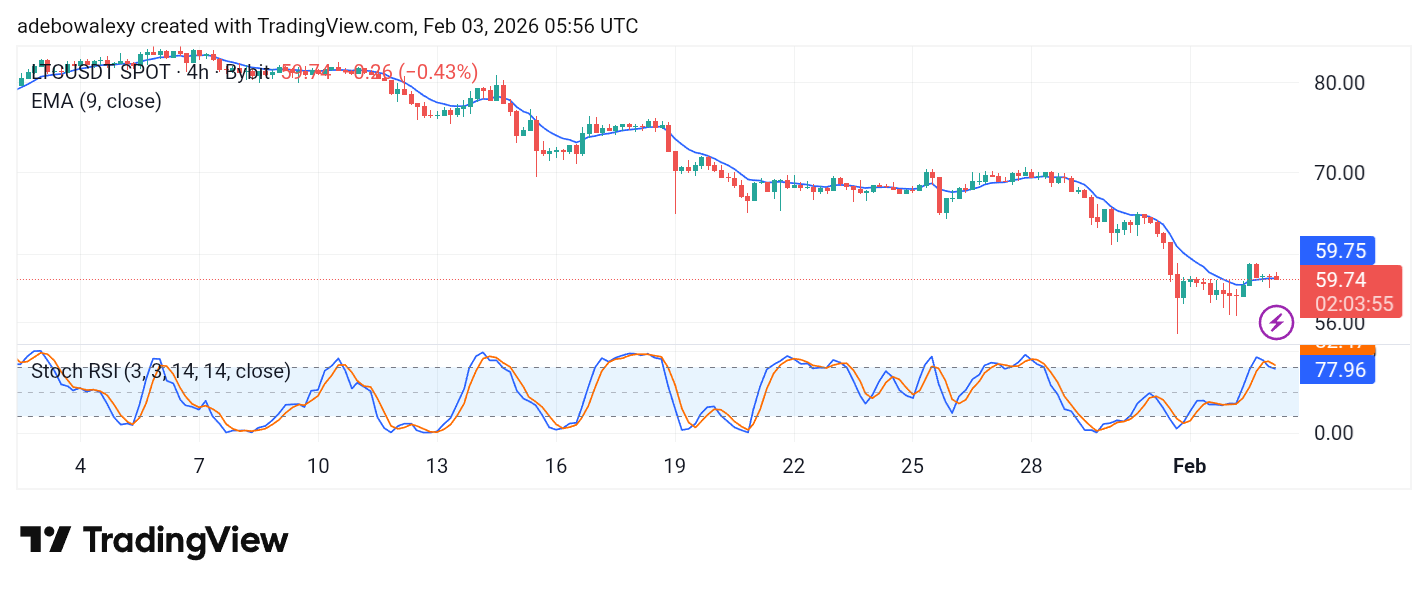
Meanwhile, the SRSI indicator lines have delivered a downward crossover and are now pushing toward lower levels. Although the SRSI remains in the overbought region above the 80 mark, the slight dip of the latest price candle just below the 9-day EMA suggests weakness. Despite this, traders may still anticipate a rebound above the $60 level toward the $65 mark in the short term.
