Litecoin (LTC) Price Prediction: LTC/USDT Trades Below $70
Estimated Reading Time: 2 minutes
Don’t invest unless you’re prepared to lose all the money you invest. This is a high-risk investment and you are unlikely to be protected if something goes wrong. Take 2 minutes to learn more
Date: January 27, 2026
After price action slumped below the $70 threshold, it has failed to move past key technical levels. Let’s see how this will play out subsequently.
LTC/USDT Long-Term Trend — Bearish (Daily Chart)
Key Price Levels
Resistance: $70, $75, $80
Support: $65, $60, $55
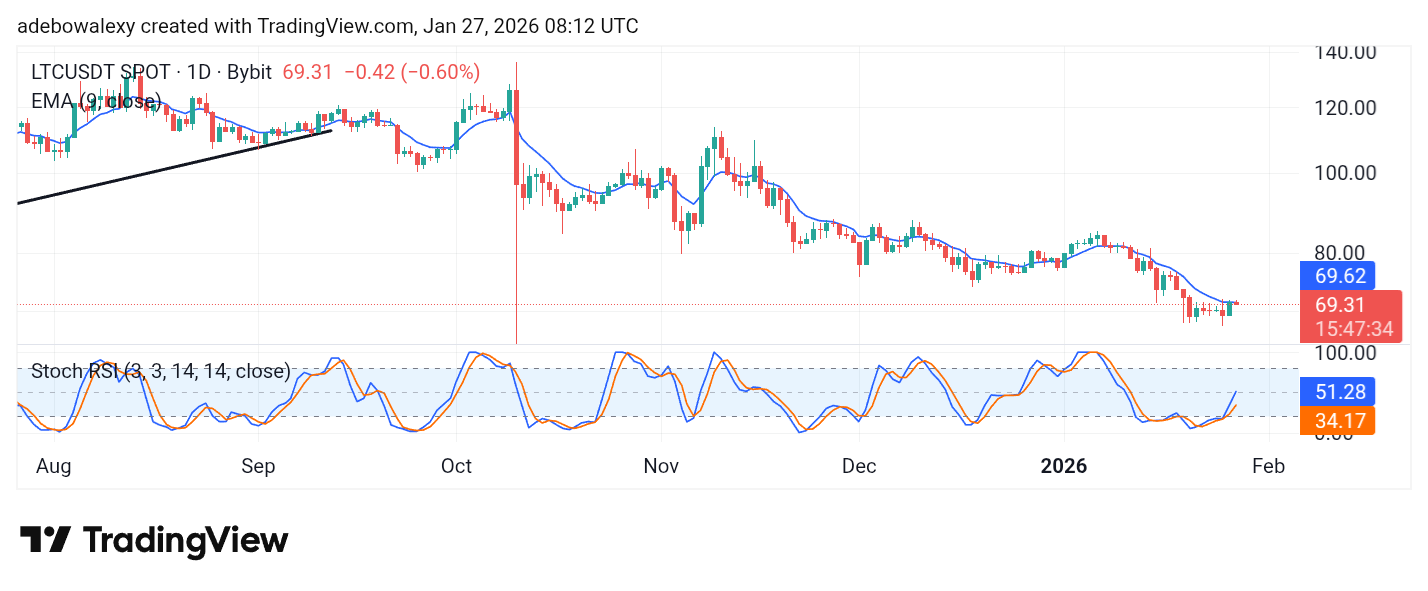
The ongoing session in the Litecoin daily market can be seen descending back below the 9-day Exponential Moving Average (EMA) line. As such, the corresponding price candle for the current session has appeared red. Meanwhile, the lines of the Stochastic Relative Strength Index (SRSI) indicator are poised upward from the oversold region. The indicator readings currently stand at 51 and 37, respectively.
Litecoin (LTC) Price Prediction: LTC/USDT Gets Resisted at the 9-Day EMA
The Litecoin market has been under strong headwinds for some time now. Price action has remained below the 9-day EMA curve for weeks as it slides to lower levels. More recently, price candles have stayed below the $70 threshold in a consolidation phase.
Although the market rebounded upward in the previous session, the ongoing session has failed to sustain that momentum. However, the SRSI indicator lines are still projected upward from the oversold region due to the prior session’s movement. Nevertheless, the market still appears capped below critical levels.
Litecoin (LTC) Price Prediction: LTC/USDT Sees a Weak Upward Rebound
On the 4-hour price chart, price action has risen above the 9-day EMA curve. The corresponding price candle for the latest 4-hour session is green and sits above the upward-tilted 9-day EMA.
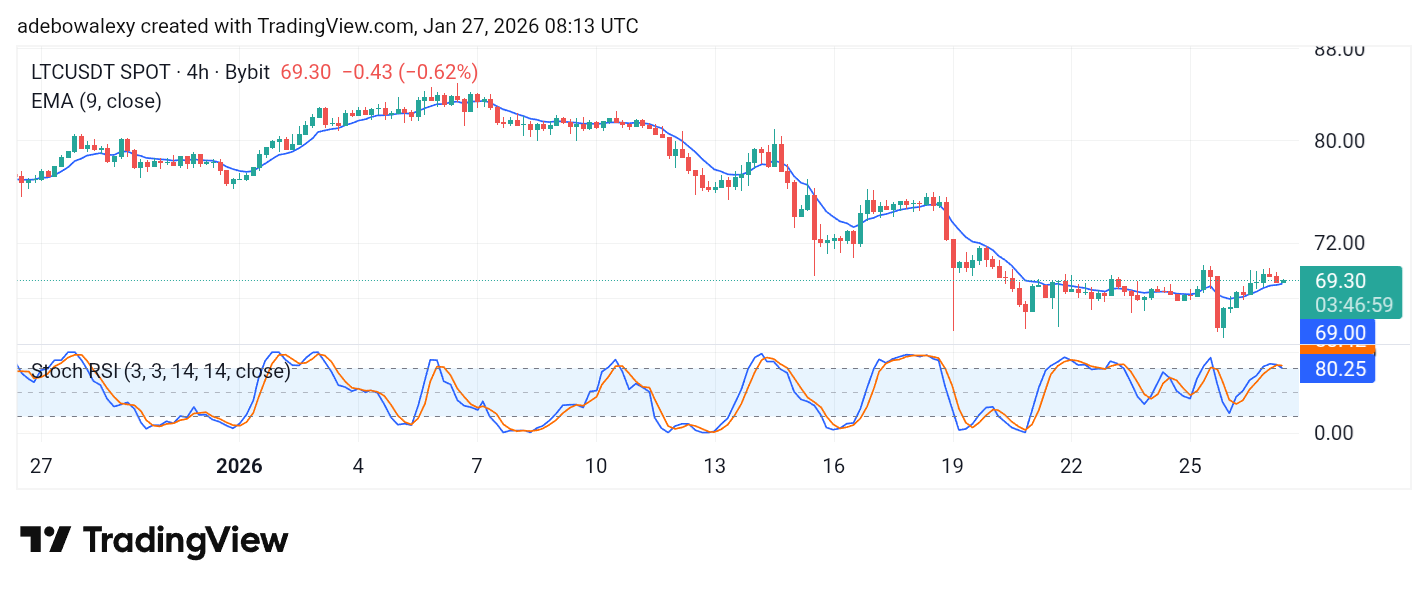
Meanwhile, the lines of the SRSI indicator are hovering just above the 80 mark. The SRSI has delivered a crossover, though the lines are still in the early stages of emerging. Therefore, traders may watch for a bounce here, as it could signal a continued upward retracement toward the $75 level.