Litecoin (LTC) Price Prediction: LTC/USDT Gets Pushed Back Above $70
Estimated Reading Time: 2 minutes
Don’t invest unless you’re prepared to lose all the money you invest. This is a high-risk investment and you are unlikely to be protected if something goes wrong. Take 2 minutes to learn more

Date: January 19, 2026
The Litecoin market has continued to slide lower over the recent past. Even now, the ongoing session has kept descending in general. However, some price movements suggest that bulls are causing a pullback.
LTC/USDT Long-Term Trend — Bearish (Daily Chart)
Key Price Levels
Resistance: $75, $80, $85
Support: $70, $65, $60
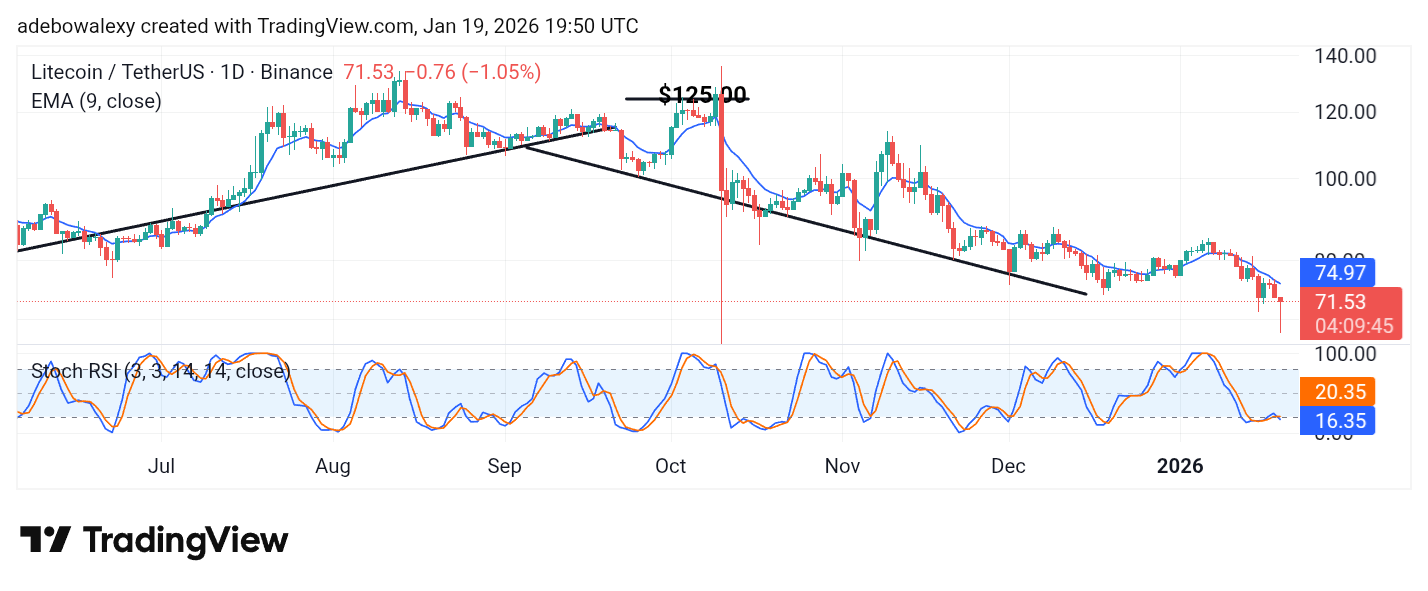
The ongoing session in the Litecoin market has produced a significant downward movement via the last price candle. This has brought trading further below the 9-day Exponential Moving Average (EMA) line. Also, while the last price candle on the chart stays generally red, it has a long lower shadow, which presents another narrative. Meanwhile, the lines of the Stochastic Relative Strength Index (SRSI) indicator are keeping a downward bearing in the oversold region.
Litecoin (LTC) Price Prediction: LTC/USDT Remains Vulnerable
While the ongoing session in the Litecoin market stays bearish, considering the current setup, it can also be found that upside forces have produced some positive contraction. Despite this, the token remains trading below the 9-day EMA curve.
Also, the SRSI indicator lines can be seen keeping a downward trajectory in the oversold region. The ensuing lines of the indicator recently delivered what seems like a downward crossover. This affirms that, in the longer term, this market may stay in a bearish trend.
Litecoin (LTC) Price Prediction: LTC/USDT Pullback Looks Strong (4-Hour Chart)
On the 4-hour price chart, it can be observed that price action has been climbing its way upward. This can be seen to have amounted to the upside-down contraction on the daily chart.
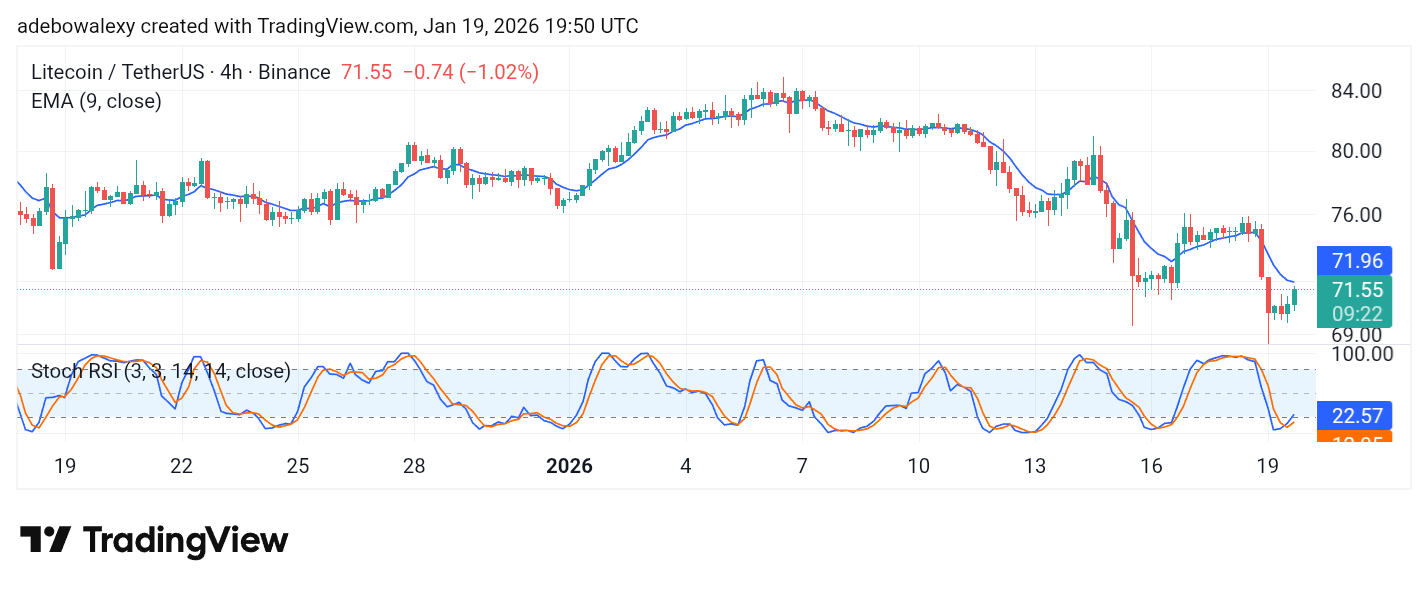
Nevertheless, trading remains below the 9-day EMA curve. The lines of the SRSI indicator are still poised upward from deep in the oversold region of the indicator. At this point, traders might want to exercise some patience, as price action needs to cross a critical level at $72 before more bullish stances can be taken in this market.