XRP (XRP/USDT) Eyes Big Move Ahead: A Breakout or Breakdown?
Estimated Reading Time: 4 minutes
Don’t invest unless you’re prepared to lose all the money you invest. This is a high-risk investment and you are unlikely to be protected if something goes wrong. Take 2 minutes to learn more
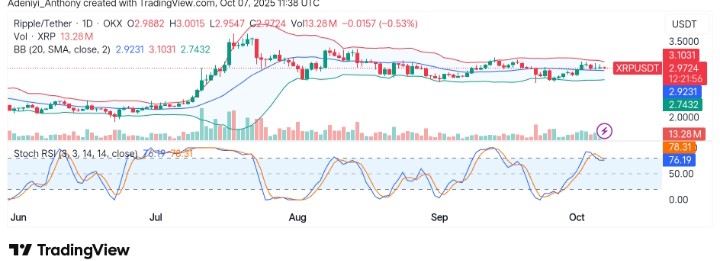
XRP against Tether, over the last few trading sessions, has been hovering within a close range. The pair appears to be currently trading under the $3.000 level, with the price consistently testing its upper Bollinger Band. Traditionally, this suggests that a major move is likely on the horizon.
The Stochastic RSI indicates that the pair operation on the daily timeframe lies in the overbought territory, adding a layer of uncertainty as traders watch for the next direction.
To this end, XRP must decisively move above resistance for a move into the $3.000 levels, while a failure to sustain the current momentum could result in a pullback.
Currently, XRP trades at $2.9724 with over 13.28 million traded volumes for the day.
Technical Indicators
Major Resistance Levels: $3.100, $3.250, and $3.500
Major Support Levels: $2.920, $2.750, and $2.500
Technical Analysis
Technically, XRP against Tether on the daily chart displays consolidation. However, the Bollinger Band squeeze and the operation of the price within the enclosed straight lines signal that the market could be preparing for a volatile move. Meanwhile, the Stochastic RSI, on the other hand, is currently suggesting a near overbought condition and a waning bullish momentum. However, the current direction of the lines upon closer inspection indicates the price may be preparing for another round of short-term upside movement.
To this end, a breakout above $3.10 with a close above this level would confirm bullish continuation in the next session. However, a drop below $2.92 would indicate that the bulls are losing control and could trigger a bearish move.
$XRP
The price is still fighting with the yellow trendline. Key spot here.The broader trend remains firmly bullish, with the July correction shaping up as a mid-cycle consolidation rather than a reversal. The $2.65 support has continued to hold strong, while price action is… pic.twitter.com/RABXvw0JF8
— More Crypto Online (@Morecryptoonl) October 6, 2025
Meanwhile, @Morecryptooonline believes that the price of XRP is still struggling with the major resistance and that the broader market situation remains bullish, with the support at $2.65 still acting strong. The analyst opined that the recent drop in price does not mean a reversal but a short-term consolidation.
XRP/USDT Analysis: Expectations
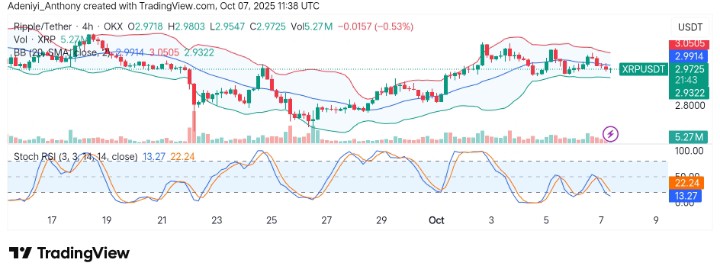
On the 4H chart, XRP/USDT has recently dipped below a major support level and is now heading for the lower Bollinger Band at around $2.930.
On one hand, the Stochastic RSI is currently in the oversold zone, signaling potential for a short-term reversal. On the other hand, the price appears to be trading the current tide with increasing volume, depicting the presence of sell pressure in the market. As it stands, if the price struggles to bounce back, the bearish momentum could continue toward the $2.80 range.
To this end, XRP is at a critical juncture in the 4-hour chart; failure to regain bullish momentum above the dynamic resistance level could lead to further moves in the current direction.
You can purchase crypto coins here. Buy Crypto