XRP (XRP/USDT) Consolidates as Momentum Indicator Indicates Strength
Estimated Reading Time: 3 minutes
Don’t invest unless you’re prepared to lose all the money you invest. This is a high-risk investment and you are unlikely to be protected if something goes wrong. Take 2 minutes to learn more

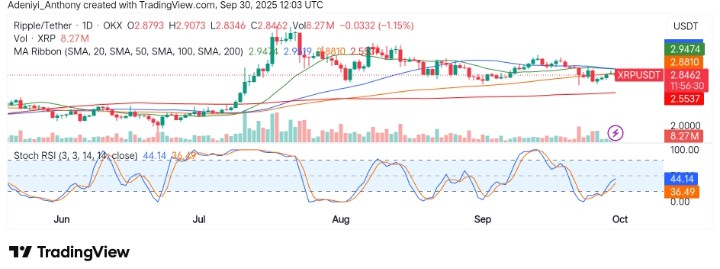
The XRP against the Tether pair has exhibited a lot of significant volatility in recent times, as the pair continues to oscillate within a narrow space. However, the most recent price action signals cautious optimism as the Stochastic RSI suggests bearish strength appears to be waning as the price prepares to break above the immediate resistance level at $2.8810.
To this end, the next direction of the pair strongly depends on the price action around the immediate major resistance and support level, as a clear sign is needed.
Currently, XRP trades at $2.8462, recording over 8.27 million traded volumes at the present time.
Technical Indicators
Major Resistance Levels: $2.9474, $3.0000, and $3.5000
Major Support Levels: $2.8000, $2.7000, and $2.5537
XRP Technical Analysis
Technically, XRP against Tether appears to be operating at a price lower than the value indicated by the 100-day simple moving average, as the price seems to have failed that level before now. This action suggests the pair is looking for support after the recent dip.
However, the Stochastic RSI stance on the issue is neither bullish nor bearish, but the upward-facing lines of the indicator signal the price may be poised for a short-term upside breakout in the near term. As it stands, the coin is affected by SEC 19b-4 filings and their impact on institutional adoption, further increasing the market’s complexity.
To this end, a move below $2.8000 or $2.7900 may attract further dips, but more is expected with a sustained move above the 100-day resistance level.
XRP Price Prediction: Be Ready for This Move
Nothing spectacular has happened for XRP in the last 24 hours. The overall crypto market, however, has shown strength. XRP could continue higher towards $2.95 today. Since Sunday, the coin has moved between $2.82 and $2.80, reclaiming this level.
XRP/USDT Analysis: The Bulls Are Eyeing a Breakout Above $2.9000
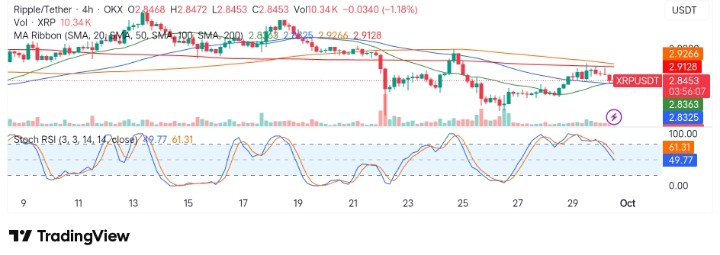
On the 4H chart, XRP/USDT seems to be consolidating around the $2.8500 level with the momentum oscillator around the 60-mark level. This shows the pair is set for a bullish ride. However, the price is finding it hard to cross above the $2.9000 resistance level, as the long-term simple moving averages appear strong above the current price level.
To this end, if the bulls’ expectation would materialize depends on the price action around this level; a break below the short-term moving averages could lead to the retest of $2.5500.
You can purchase crypto coins here. Buy Crypto