$SPONGE (SPONGE/USD): Oversold Zone Signals a Potential Short Squeeze
Estimated Reading Time: 3 minutes
Don’t invest unless you’re prepared to lose all the money you invest. This is a high-risk investment and you are unlikely to be protected if something goes wrong. Take 2 minutes to learn more

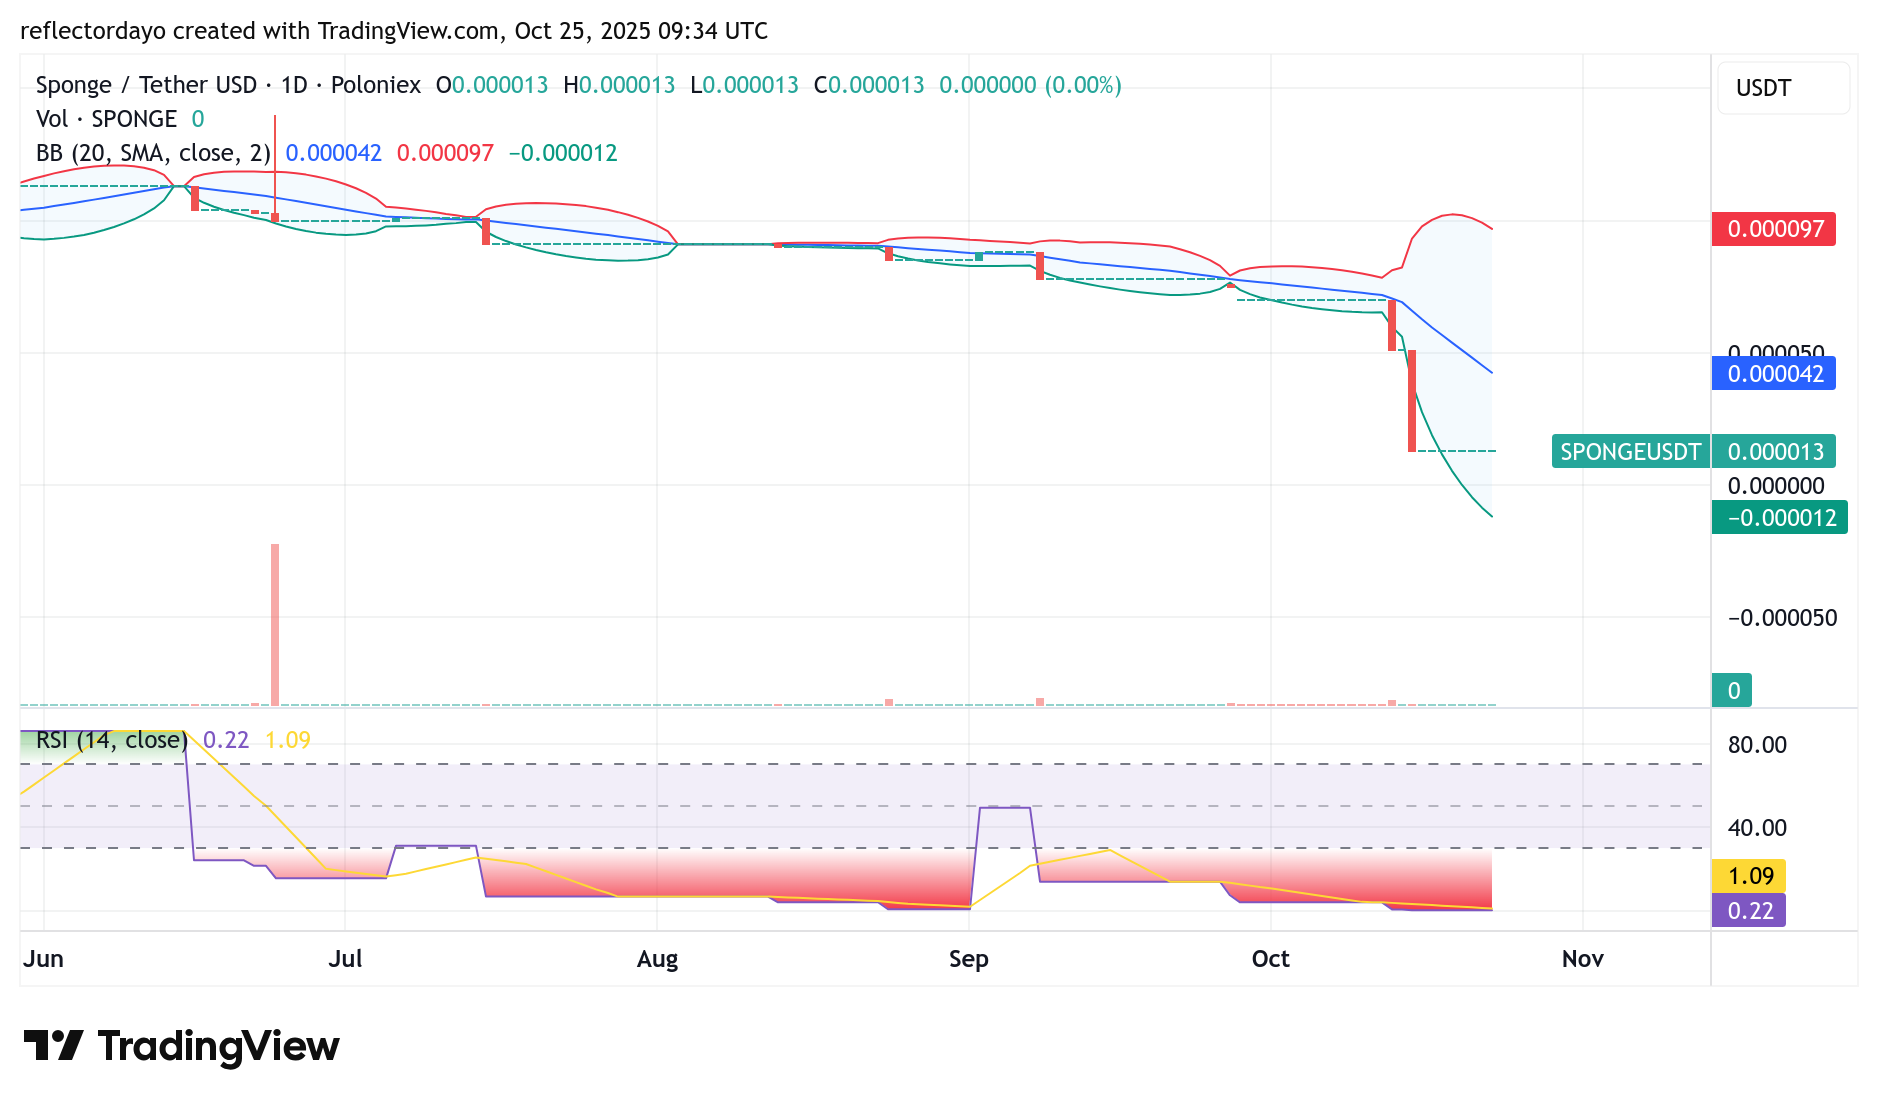
The daily chart paints a picture of exhaustion among SPONGE/USD sellers, with four consecutive Doji candles signaling indecision and a possible handover from bears to bulls. This type of pattern often hints that a reversal could be brewing beneath the surface.
At such oversold levels, smart money typically begins accumulating—quietly but deliberately. Evidence suggests that accumulation is underway, creating the perfect conditions for a short squeeze once the market catches its first whiff of upward momentum.
Market Structure: Bulls vs. Bears
- Resistance Targets: $0.000115, $0.000120, $0.000130
- Key Support Levels: $0.000010, $0.000009, $0.000008
Daily Chart Analysis: Deeply Oversold and Primed for a Bounce
The RSI has plunged into extreme oversold territory, and the SPONGE/USD price action recently slipped below the lower Bollinger Band, indicating the market may have overextended to the downside. Historically, such conditions rarely last long. When markets become this stretched, mean reversion tends to follow—and it can happen fast.
The recent stabilization near $0.000013 suggests that selling momentum has dried up. A decisive move above $0.00002 could confirm the start of a recovery phase and ignite renewed bullish energy.
4-Hour Chart Outlook: High Volatility, High Opportunity
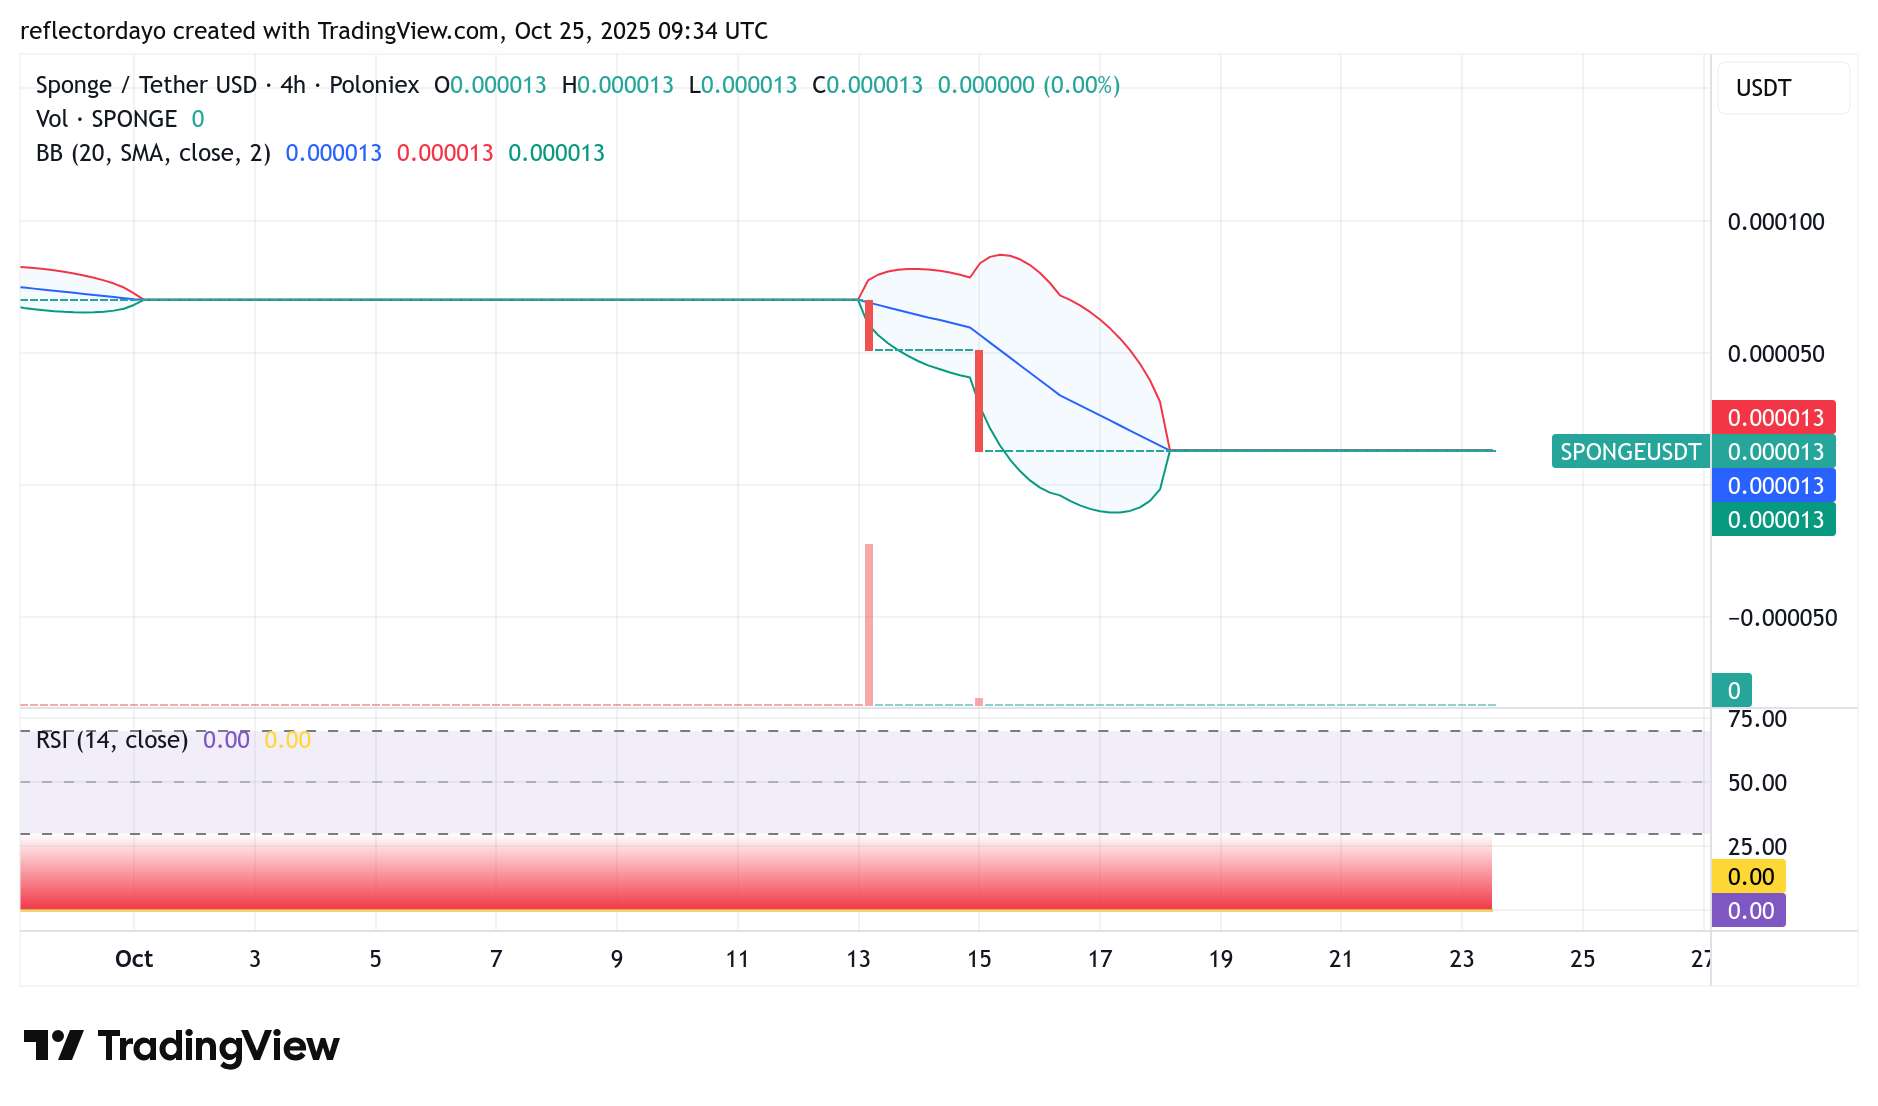
The 4-hour timeframe hints at a volatile breakout setup. Should a rebound materialize, the initial upside target sits near $0.00006, with room for further gains if momentum accelerates. Given the current volatility compression, a breakout could trigger a swift, high-volume rally—a classic recipe for a short squeeze scenario.
$SPONGE is showing early signs of stabilization after a prolonged capitulation phase. With technicals flashing oversold signals and accumulation patterns emerging, traders should keep a close eye on this setup. A sustained move above near-term resistance could mark the beginning of a sharp corrective rally, offering agile traders a potentially rewarding opportunity in the days ahead.
Buy $SPONGE!
Degens: ‘I can handle the stress”
Also Degens: pic.twitter.com/ppjOLacWaq
— $SPONGE (@spongeoneth) October 22, 2025
Join the SPONGE community and get in on the next big crypto opportunity! Buy Sponge ($SPONGE) today