Dogecoin (DOGE) Price Prediction: DOGE/USDT Consolidates Below the $0.1000 Threshold
Estimated Reading Time: 2 minutes
Don’t invest unless you’re prepared to lose all the money you invest. This is a high-risk investment and you are unlikely to be protected if something goes wrong. Take 2 minutes to learn more

Date: February 9, 2026
The Dogecoin market has been moving from one lower support level to another. However, this trend is common among most coins lately. As such, this market still appears to be under heavy pressure and may wind up at lower price levels.
DOGE/USDT Long-Term Trend — Bearish (Daily Chart)
Key Price Levels
Resistance: $0.1000, $0.1150, $0.1300
Support: $0.0900, $0.0800, $0.0700
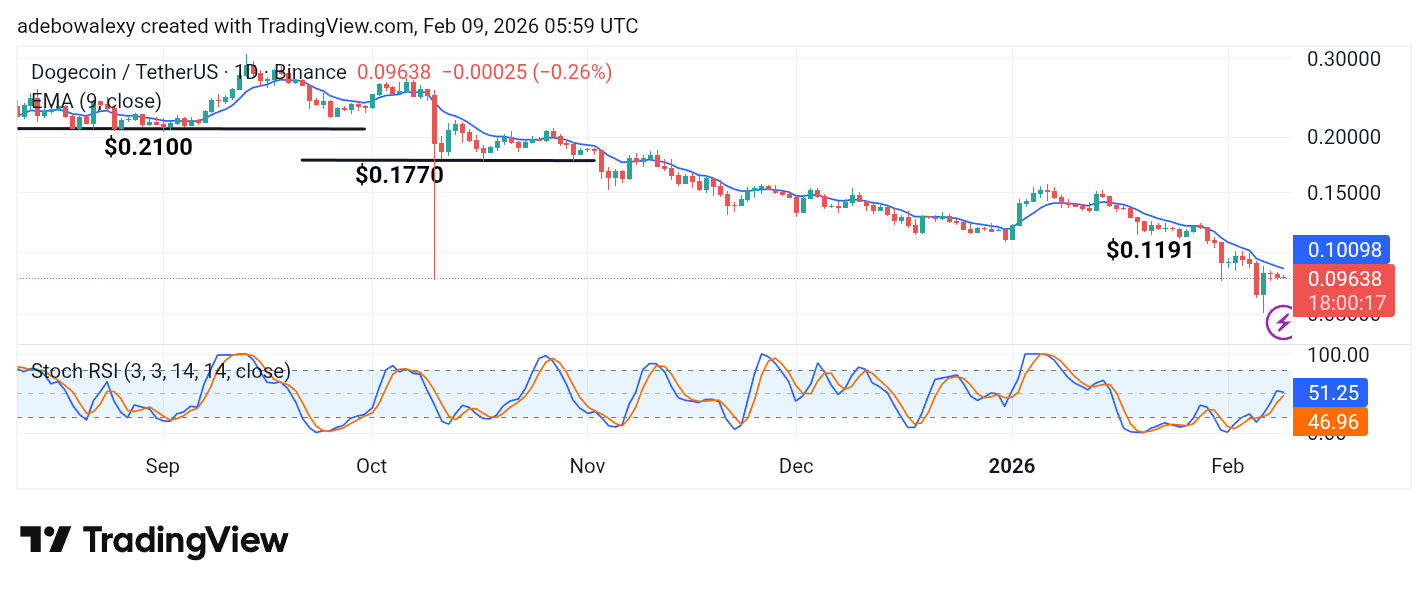
Recently appearing price candles in the Dogecoin market have been red. The most recent price candle is red but very small. Additionally, price action can be seen trading below the 9-day Exponential Moving Average (EMA) line. In addition, the Stochastic Relative Strength Index (SRSI) lines show a generally upward bias, but with convergence toward a potential bearish crossover near the terminal.
Dogecoin (DOGE) Price Prediction: DOGE/USDT Continues to Tilt Toward a Bearish Path
Although it is clear that price action remains under the influence of headwinds, bearish forces are also encountering some resistance. This appears largely due to a possible loss of bearish momentum at this point.
Nevertheless, the position of price action below the 9-day EMA curve still gives bears an edge. Additionally, the SRSI lines are tilting toward a crossover while remaining generally pointed upward. However, stronger bearish pressure could trigger the crossover, resulting in a more pronounced downward move in this market.
Dogecoin (DOGE) Price Prediction: DOGE/USDT Generally Consolidates but May Descend
Even on shorter market timeframes, such as the 4-hour chart, the Dogecoin market remains consistent with a bearish outlook. Here, price activity stays below the 9-day EMA curve, even as it closely follows this technical level.
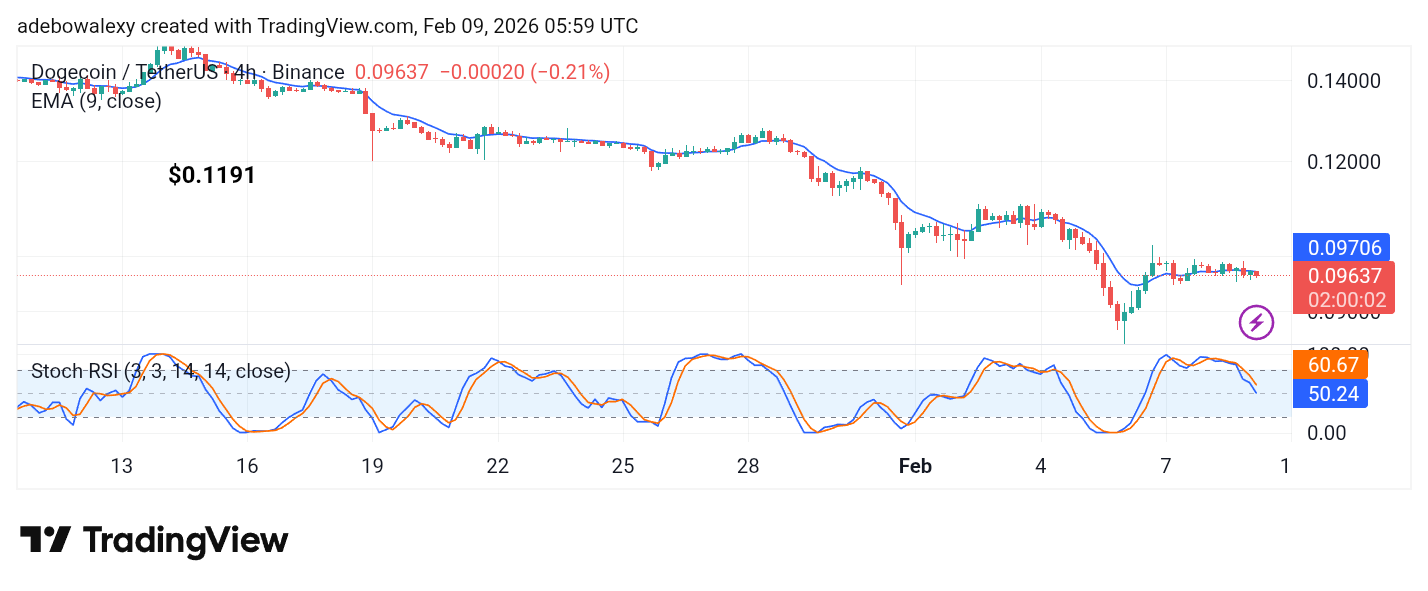
The current session’s price candle is red and places the token’s price below the 9-day EMA curve. Additionally, the SRSI indicator lines are declining toward the 50 level. As it stands, this market may edge toward the $0.0950 price level.