Ethereum Advances but Encounters Resistance Near $2,300
Estimated Reading Time: 2 minutes
Don’t invest unless you’re prepared to lose all the money you invest. This is a high-risk investment and you are unlikely to be protected if something goes wrong. Take 2 minutes to learn more

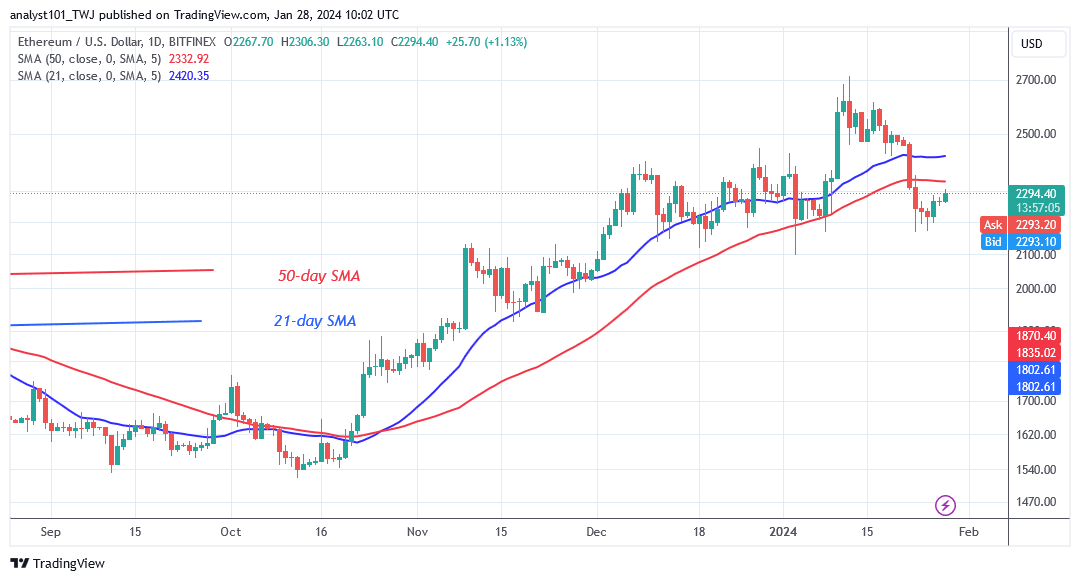
Ethereum Price Long-Term Analysis: Bearish
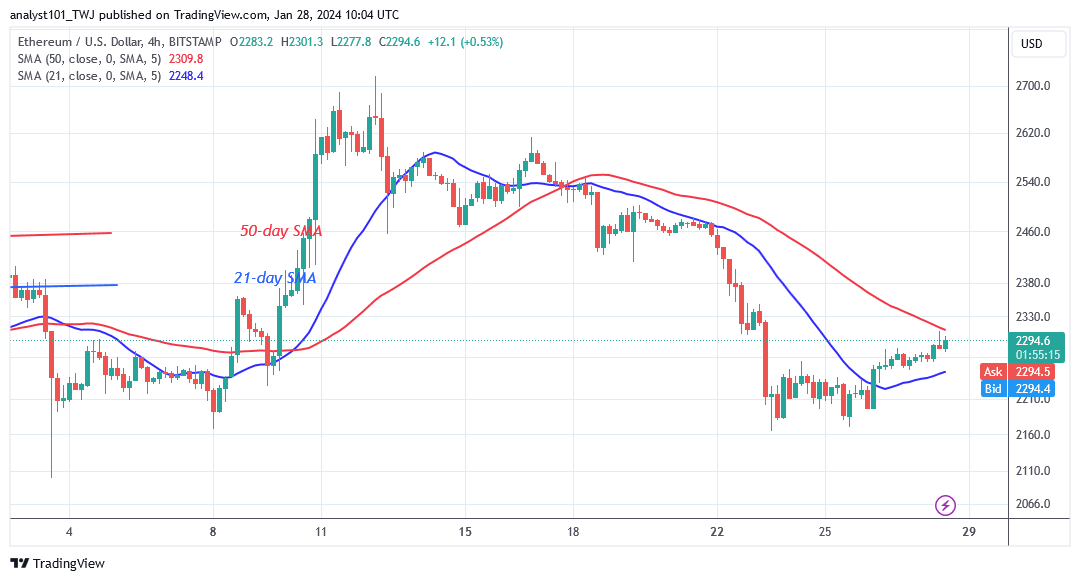
Ethereum’s (ETH) price has recovered above the $2,168 support but encounters resistance near $2,300. For the past week, selling pressure has abated, and the cryptocurrency’s price has been consolidating above the existing support. In addition, Ether is returning to its earlier highs. The rising advances are likely to be rejected at the $2,400 resistance level and the moving average lines.
Furthermore, a break above the moving average lines will cause the altcoin to resume its upward trend. In contrast, the sideways trend will resume if buyers fail to sustain the price above the moving average lines. ETH/USD is now trading at $2,294 at the time of writing.
Technical indicators:
Major Resistance Levels – $2, 600, $2,800, $3,000
Major Support Levels – $1.600, $1, 400, $1,200
Ethereum Indicator Analysis
The price bars for Ether are below the moving average lines, however they are correcting upward to their former highs. On the daily chart, the moving average lines slope northward, indicating the previous trend. Price barriers have restrained the movement of Ether prices.
Conclusion
ETH/USD has found support above $2,168 but encounters resistance near $2,300. Ether is currently trading between $2,168 and $2,300. On the upside, a price rebound above the current support will cause Ether to rally above the moving averages. On the upside, bullish crypto signals abound if buyers can break above the moving average lines.
You can buy crypto coins here. Buy LBLOCK
Note: Cryptosignals.org is not a financial advisor. Do your research before investing your funds in any financial asset or presented product or event. We are not responsible for your investing results