Ethereum (ETH) Surges Ahead, May Rally Above $2,800
Estimated Reading Time: 2 minutes
Don’t invest unless you’re prepared to lose all the money you invest. This is a high-risk investment and you are unlikely to be protected if something goes wrong. Take 2 minutes to learn more

Ethereum Price Long-Term Analysis: Bullish
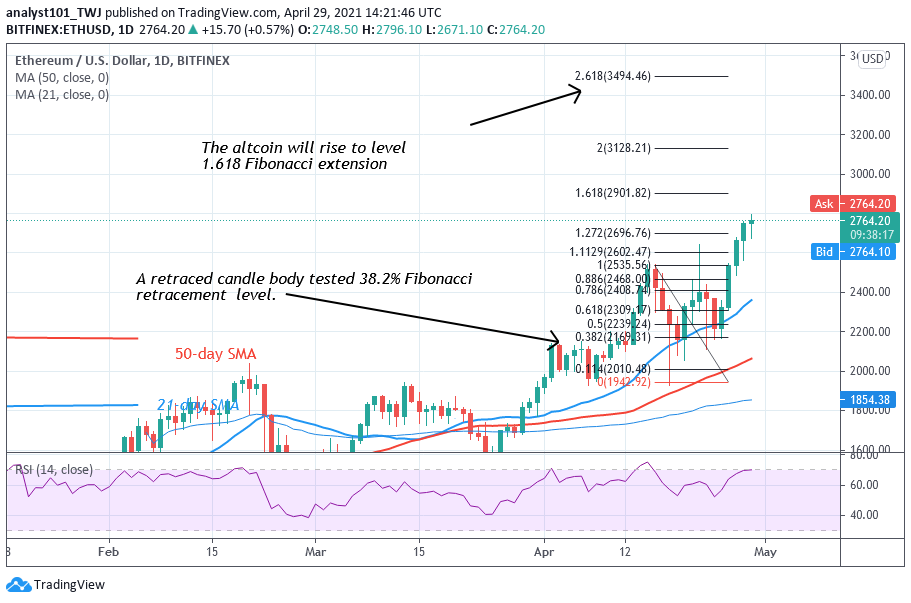
In its current uptrend, Ethereum bulls have broken the resistance at $2,544 and $2,600. Buyers are sustaining the bullish momentum as price reaches a high of $2,767.40. Meanwhile, the Relative Strength Index has indicated that Ether price has reached the overbought region of the market. On April 15 uptrend; a retraced candle body tested the 38.2% Fibonacci retracement level. The retracement indicates that the market will rise to level 2.618 Fibonacci extensions or high of $3494.46.
Ethereum Indicator Analysis
The biggest altcoin has risen to level 70 of the Relative Strength Index period 14. It implies that price has reached the overbought region of the market. The coin has not enough room to rally on the upside. Also, Ether is above 88% range of the daily stochastic. The overbought region implies that sellers may emerge.
Technical indicators:
Major Resistance Levels – $2, 600, $2,800, $3,000
Major Support Levels – $1.500, $1, 300, $1,100
What Is the Next Direction for Ethereum?
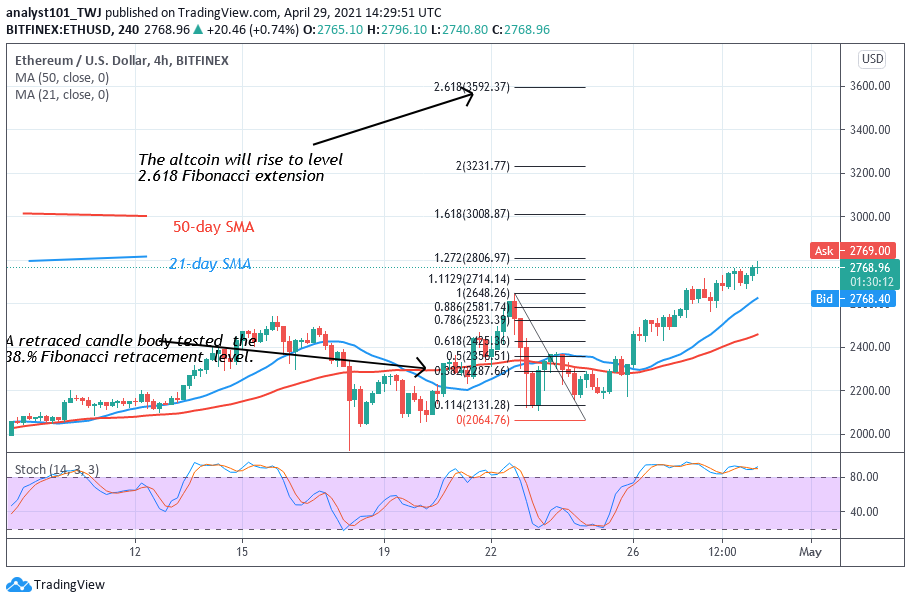
On the 4- hour chart, Ether is in a strong uptrend as the market reaches new highs. The biggest altcoin is approaching the high $2,800. However, as price reaches the high of $3,000, the market may show signs of an overbought condition. Nevertheless, in a trending market, an overbought condition may not hold.
Note: cryptosignals.org is not a financial advisor. Do your research before investing your funds in any financial asset or presented product or event. We are not responsible for your investing results