Ethereum Fluctuates above $1,157 but Is Unable to Sustain above $1,200
Estimated Reading Time: 3 minutes
Don’t invest unless you’re prepared to lose all the money you invest. This is a high-risk investment and you are unlikely to be protected if something goes wrong. Take 2 minutes to learn more
Ethereum Price Long-Term Analysis: Bearish
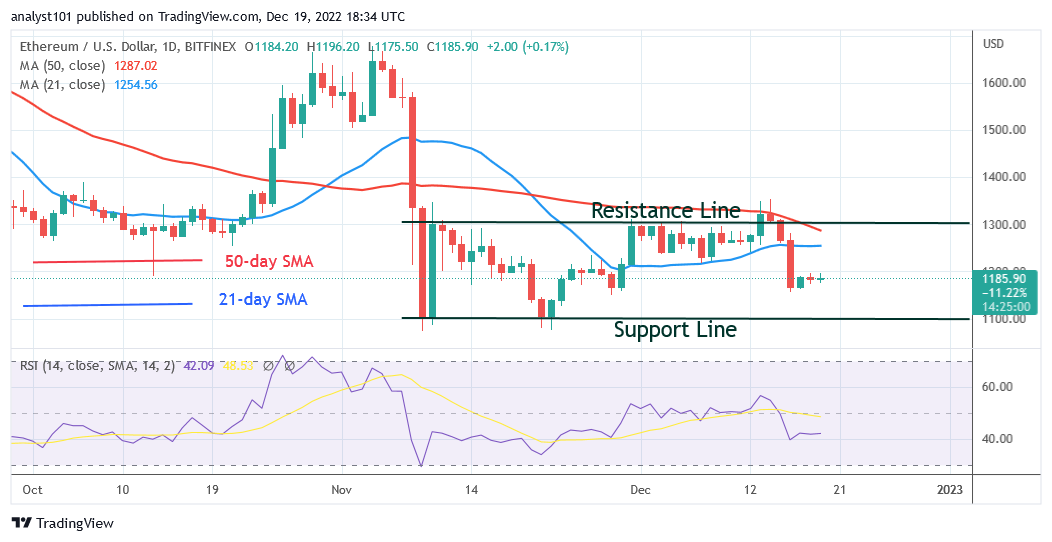
Following the price drop on December 16, Ethereum (ETH) is but is unable to sustain above $1,200. The altcoin’s bearish momentum has subsided as it has remained above the $1,157 support level. The altcoin plummeted to a low of $1,157 on December 16 as bulls pounced on dips. The bulls bought the dips, but the upward movement is stifled by the $1,200 resistance. Ether has maintained above the current support level since then. The price action is now defined by little body candlesticks dubbed Doji. This illustrates the indecision between buyers and sellers. On the negative side, if the current support level is breached, Ether will plummet considerably further. Ether will revert to its previous low of $1,073. At the time of writing, it is trading at $1,192.60.
Ethereum Indicator Analysis
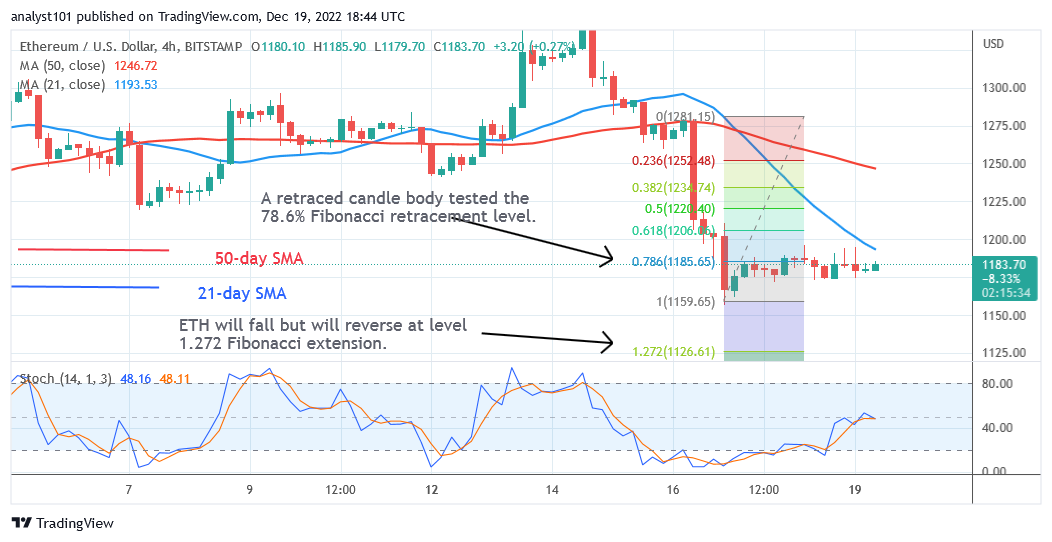
The largest altcoin, Ether, is trading in the bearish trend zone at level 42 on the Relative Strength Index for period 14. Ether is susceptible to further decrease. This indicates that it is susceptible to further deterioration. Because the price bars are lower than the moving average lines, the cryptocurrency is likely to keep declining. Above the daily Stochastic level of 40, Ether is in a bullish trend.
Technical indicators:
Major Resistance Levels – $2, 600, $2,800, $3,000
MajorSupport Levels – $1.500, $1, 300, $1,100
What Is the Next Direction for Ethereum?
Ethereum is correcting upward in a sideways motion but is unable to sustain above $1,200. If the altcoin breaks above the moving average lines, it will trade and be limited between the moving average lines. On the other side, if it experiences rejection, it may review the existing support to breach it. The Fibonacci tool analysis predicts that Ether will decrease but then reverse at the 1.272 Fibonacci extension level, or $1,126.61.
You can buy crypto coins here. Buy LBLOCK
Note: Cryptosignals.org is not a financial advisor. Do your research before investing your funds in any financial asset or presented product or event. We are not responsible for your investing results