Ethereum Remains Stable as It Prepares for a Rebound or Breakout
Estimated Reading Time: 2 minutes
Don’t invest unless you’re prepared to lose all the money you invest. This is a high-risk investment and you are unlikely to be protected if something goes wrong. Take 2 minutes to learn more
Ethereum Price Long-Term Analysis: Bearish
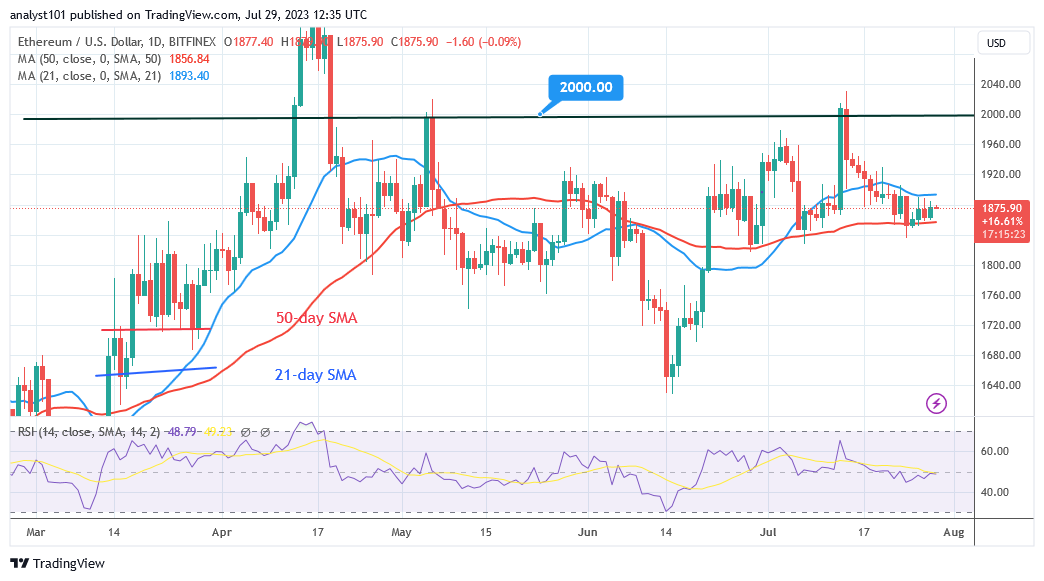
Ethereum (ETH) price remains limited within the moving average lines as it prepares for a rebound or breakout. The cryptocurrency is trading between $1,800 and $1,900. The existing levels of support and resistance have yet to be breached. Doji candlesticks have delayed price movement, which is why they are present. The cost of the cryptocurrency is rising right now.
Today, the crypto’s price is growing. A price recovery over the present support level will send the altcoin above the 21-day SMA. The bullish momentum will continue until the price reaches $2,000. If Ether fails to recover, the present range-bound trend will continue for a few more days. Meanwhile, the altcoin is increasing in value.
Technical indicators:
Major Resistance Levels – $2, 600, $2,800, $3,000
Major Support Levels – $1.600, $1, 400, $1,200
Ethereum Indicator Analysis
The Relative Strength Index for period 14 is 48. The RSI has not changed because of the range-bound movement of the coin. The price bars have been held in place by the moving average lines. This has been accountable for the range-bound move’s continuation. The coin has a positive momentum over the daily Stochastic threshold of 40.
Conclusion
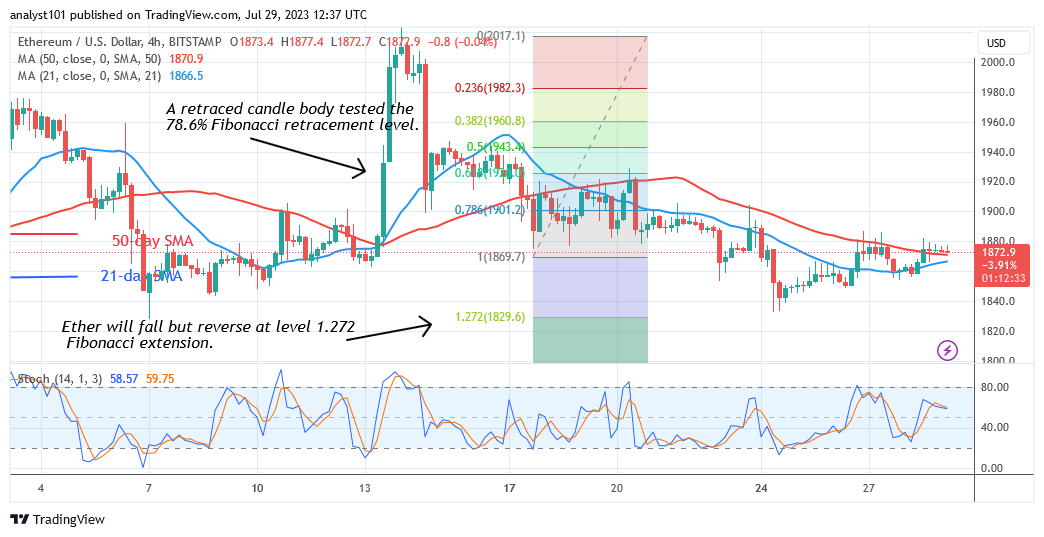
Since July 22, the price of Ethereum has stayed constant as it prepares for a rebound or breakout. The rising movement is currently halted below the resistance level of $1,880. Nonetheless, Ether’s current restricted range and constraint will force it to rebound in the next few days. In the meantime, the Doji candlesticks have continued to limit price movement.
You can buy crypto coins here. Buy LBLOCK
Note: Cryptosignals.org is not a financial advisor. Do your research before investing your funds in any financial asset or presented product or event. We are not responsible for your investing results