Rate of Change (ROC) Indicator
Estimated Reading Time: 4 minutes
Don’t invest unless you’re prepared to lose all the money you invest. This is a high-risk investment and you are unlikely to be protected if something goes wrong. Take 2 minutes to learn more

The Rate of Change (ROC) indicator is a momentum-driven analytical tool utilized in technical analysis to evaluate the percentage shift in price between the present value and a historical price over a defined timeframe. It serves as a valuable resource for traders in determining the intensity and trajectory of market trends.
This indicator functions as a momentum-based metric in financial markets, gauging both the velocity and direction of price fluctuations over a set period. By leveraging this tool, traders and analysts can assess trend strength and detect possible reversal points in market movements.
Formula
𝑅𝑂𝐶= Current Price − Price 𝑛 periods ago / Price 𝑛 periods ago × 100
Where:
The current Price is the latest closing price.
Price n periods ago is the closing price n periods before the current price.
n is the chosen period for calculation (e.g., 10, 14, or 25 days).

How It Works
A positive ROC indicates upward momentum (bullish).
A negative ROC indicates downward momentum (bearish).
A zero ROC suggests no price change over the given period.
Utilizing the Rate of Change (ROC) Indicator in Trading
An increasing ROC value typically indicates an upward trend, whereas a declining ROC suggests a downward movement in price.
Recognizing Overbought and Oversold Levels
Extreme ROC readings can serve as potential warning signs of upcoming price reversals, helping traders anticipate market shifts.
Spotting Divergences
When price action moves in one direction while the ROC trends in the opposite direction, it may signal weakening momentum, hinting at a possible trend reversal.
Generating Trading Signals with the ROC Indicator
The Rate of Change (ROC) indicator helps traders identify shifts in momentum, confirm trends, and detect overbought or oversold conditions. Here’s how it can be used to generate actionable trading signals:
Interpreting the Rate of Change (ROC) Indicator for Trading
1. Identifying Trends
– A ROC above zero and rising signals strengthening bullish momentum, suggesting a potential buy opportunity.
– A ROC below zero and declining indicates growing bearish momentum, signaling a potential sell opportunity.
– A flat or near-zero ROC suggests weak momentum, often corresponding to a sideways or consolidating market.
Trading Signal:
– Enter a buy position when the ROC crosses above zero, confirming an uptrend.
– Enter a sell position when the ROC drops below zero, confirming a downtrend.
2. Detecting Overbought & Oversold Conditions
– An excessively high ROC suggests an overbought market, increasing the likelihood of a downward price correction.
– An extremely low ROC indicates an oversold market, raising the probability of an upward price reversal.
Trading Signal:
– Consider selling when the ROC reaches an extreme high and begins to decline.
– Consider buying when the ROC hits an extreme low and starts to rise.
3. Analyzing Divergences
– Bullish Divergence: If the price forms a lower low while the ROC forms a higher low, it suggests weakening downward momentum and a possible trend reversal to the upside.
Bearish Divergence: If the price forms a higher high while the ROC forms a lower high, it indicates fading upward momentum and a potential trend reversal downward.
Trading Signal:
– Look for buying opportunities when a bullish divergence appears and the price starts to rise.
– Consider selling when a bearish divergence emerges and the price begins to fall.
Crossover Strategy with Moving Averages
Some traders incorporate a moving average (e.g., a 10-period MA) into the ROC indicator and use crossovers to guide their trading decisions.
Trading Signal:
– Buy when the ROC crosses above its moving average, signaling increasing momentum.
– Sell when the ROC drops below its moving average, indicating weakening momentum.
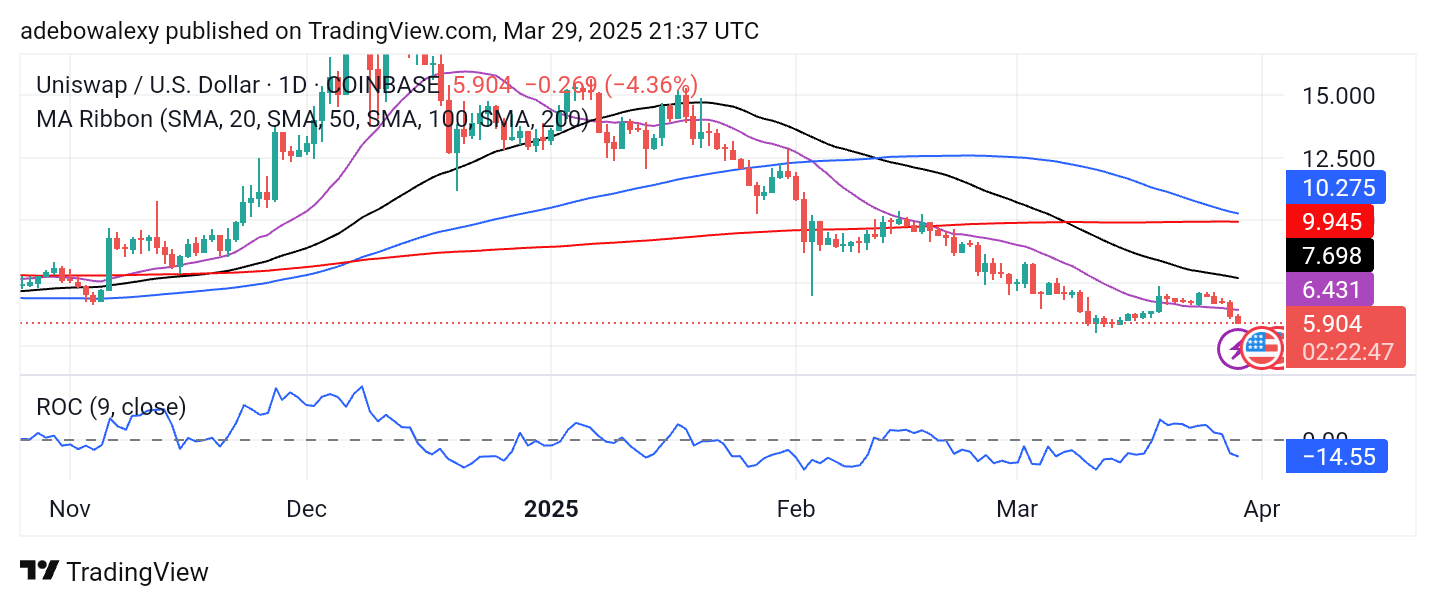
For example, in the Uniswap market, price action remained slightly above the 20-day moving average, causing the ROC line to oscillate just above the 0.00 threshold. However, the ROC later dipped toward the zero level, hinting at a potential breakdown of the $6.00 support zone. As anticipated, the market eventually breached this support level. Given this scenario, entering a short position would have been the optimal trading move.