Lucky Block Builds Quiet Strength as the Next Move Takes Shape
Estimated Reading Time: 3 minutes
Don’t invest unless you’re prepared to lose all the money you invest. This is a high-risk investment and you are unlikely to be protected if something goes wrong. Take 2 minutes to learn more

Lucky Block (LBLOCK) is showing encouraging signs of balance and structure as it trades around $0.00001385, suggesting the market may be laying the groundwork for a fresh advance. Rather than signaling weakness, the current price behavior reflects a calm, controlled phase where selling pressure has eased and buyers are beginning to reassert themselves. This type of environment often marks the transition from correction to recovery, positioning Lucky Block as an increasingly interesting project to watch as momentum gradually rebuilds.
Daily Chart – Where Stability Turns Into Opportunity
On the daily chart, LBLOCK is holding comfortably near the middle of the Bollinger Bands, a sign that price action has entered a phase of equilibrium. The narrowing bands point to declining volatility, a technical condition that frequently precedes a meaningful breakout. Crucially, the recent floor near $0.00001170 has remained intact, reinforcing confidence that a durable base is forming rather than another leg lower.
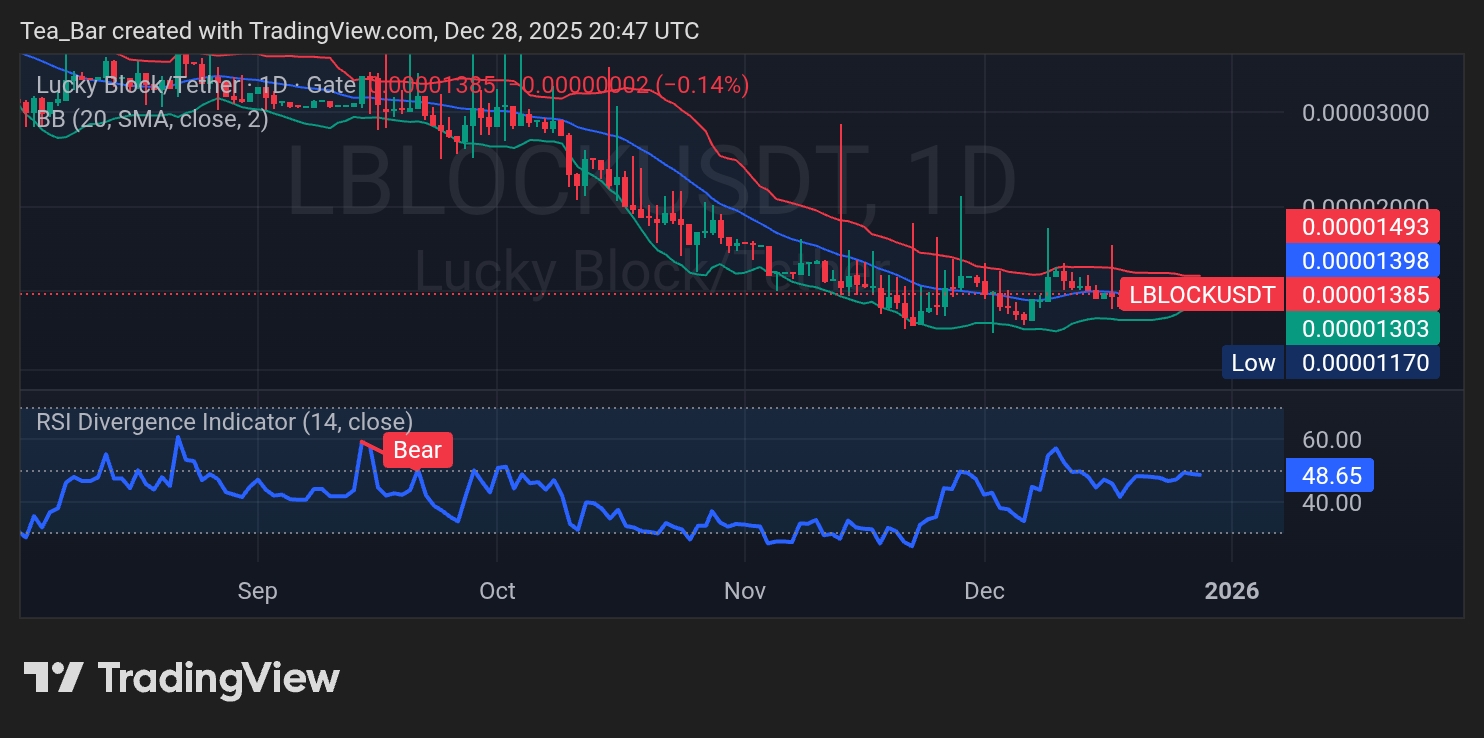
Momentum indicators echo this stabilizing narrative. The RSI hovering around the neutral 50 level suggests bearish pressure has largely been absorbed, leaving room for a constructive push higher. A decisive move above the mid-band near $0.00001398 would strengthen the bullish case and could invite a gradual climb toward the upper band around $0.00001493, signaling the early stages of trend recovery.
4H Chart – The Market Holds Its Breath
Zooming into the 4-hour timeframe, Lucky Block is compressing within a tight range between $0.00001373 and $0.00001398. This orderly consolidation reflects growing market patience and often hints at accumulation by forward-looking participants. The flattening Bollinger Bands underline the idea that price is coiling, preparing for its next directional move rather than drifting aimlessly.
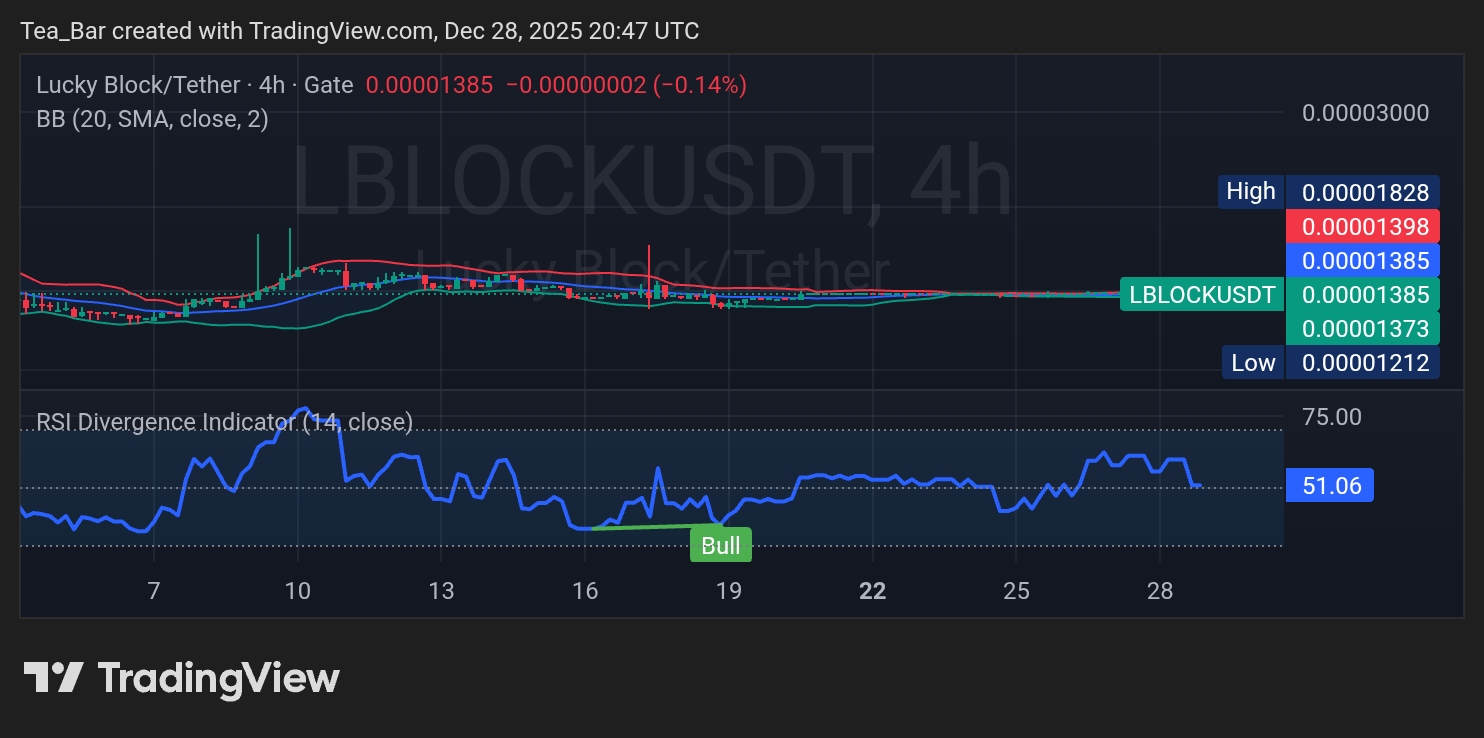
The 4-hour RSI sitting slightly above 50 adds a subtle bullish bias, showing that buyers are quietly gaining the upper hand. A clean break above the upper band could act as a trigger for short-term momentum traders, potentially propelling LBLOCK toward the recent swing high near $0.00001828.
Conclusion – A Calm Phase With Promising Potential
Lucky Block’s current structure is defined by stability, tightening volatility, and improving momentum across both daily and intraday charts. These conditions often precede stronger moves, especially when selling pressure has already been absorbed. As this consolidation matures, LBLOCK appears well-positioned for a renewed upside phase, making this an opportune moment to keep Lucky Block firmly on the radar.
Invest wisely, and let Lucky Block’s potential work in your favor. You can purchase Lucky Block here. Buy LBLOCK