Lucky Block (LBLOCK): Chart Patterns Suggest Potential for New Gains
Estimated Reading Time: 3 minutes
Don’t invest unless you’re prepared to lose all the money you invest. This is a high-risk investment and you are unlikely to be protected if something goes wrong. Take 2 minutes to learn more

Lucky Block (LBLOCK) is currently trading around $0.00002252, showing a modest increase of 0.67% in the past 24 hours. The 4-hour and daily charts both highlight intriguing setups, suggesting that LBLOCK may be preparing for its next move. Let’s dive into the technical indicators on each chart to get a clearer picture of what may lie ahead.
4-Hour Chart: Signs of Stability and Potential Growth
On the 4-hour chart, LBLOCK is trading slightly above the Bollinger Bands’ median, with resistance at $0.00002434 and support at $0.00002125. This position indicates a stable consolidation phase, which could serve as a base for potential upward movement. If LBLOCK can sustain its position above the median, a push towards the upper resistance level may be on the cards.
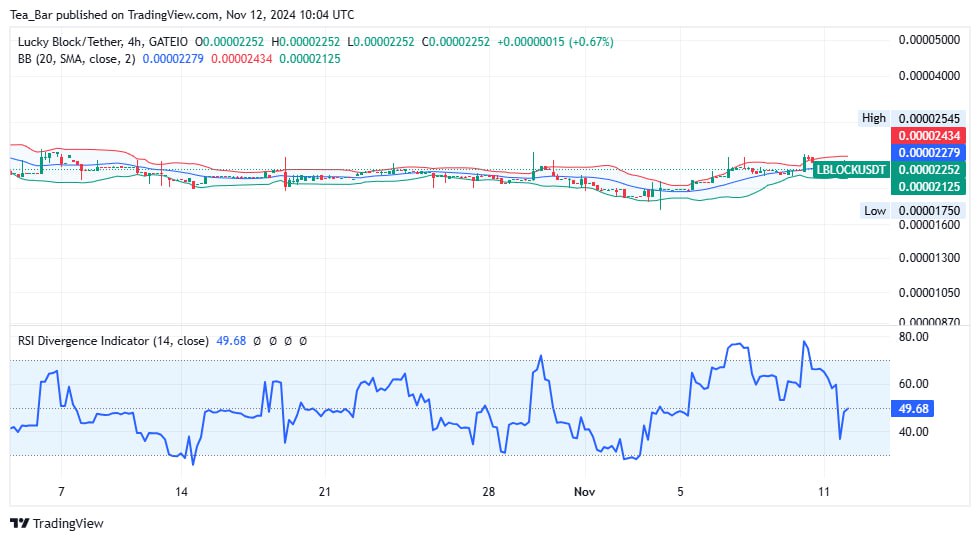
The RSI on this shorter timeframe is at 49.68, just under the neutral 50 mark. This suggests a balanced market with neither buyers nor sellers holding a dominant position. However, should buyers step in, we might see the RSI climb above 50, signaling a shift in momentum towards bullish territory.
Daily Chart: Momentum Building for a Breakout?
Looking at the daily chart, LBLOCK sits comfortably within the Bollinger Bands, trading near $0.00002252. The upper resistance band at $0.00002370 could be the next target if LBLOCK gains momentum. Meanwhile, support at $0.00001919 provides a solid base for any short-term corrections.
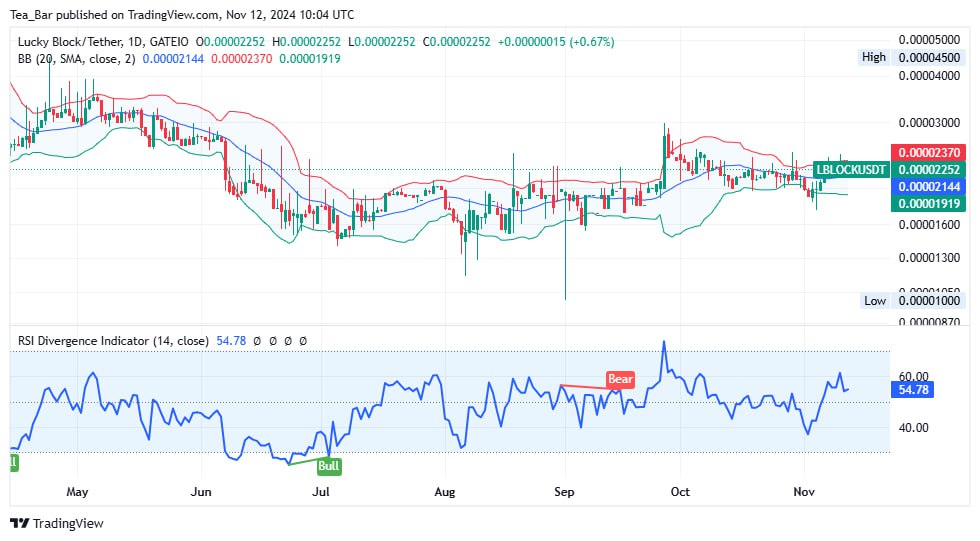
The daily RSI reads 54.78, indicating a slight bullish inclination. This position above 50 suggests that momentum is subtly shifting in favor of buyers. If this trend continues, LBLOCK could be poised for a breakout above the upper resistance, potentially igniting a new rally.
Future Outlook for LBLOCK
Looking ahead, LBLOCK appears well-positioned within its current range, with support levels providing a cushion against downward moves. A sustained push above $0.00002370 may open the door to further gains, drawing interest from both short-term traders and long-term holders.
In summary, Lucky Block is showing signs of strength on both the 4-hour and daily charts. With the indicators aligning, LBLOCK might be setting the stage for a new bullish phase, making it a token to watch closely in the coming days.
You can purchase Lucky Block here. Buy LBLOCK.