Lucky Block (LBLOCK) Eyes Fresh Gains: Bullish Momentum Builds Amid Strong Technical Signals
Estimated Reading Time: 3 minutes
Don’t invest unless you’re prepared to lose all the money you invest. This is a high-risk investment and you are unlikely to be protected if something goes wrong. Take 2 minutes to learn more

Lucky Block (LBLOCK) has been gaining traction with promising technical indicators suggesting a potential for further gains. With strong support levels holding firm and bullish patterns forming across multiple timeframes, LBLOCK could be gearing up for a breakout that traders have been waiting for. Here’s a closer look at the price action and what to expect.
Daily Chart Signals Strong Support for Uptrend
On the daily chart, LBLOCK is currently trading around $0.00002267, with a key support level at $0.00001763. The Parabolic SAR indicator shows dots positioned below the price, a positive sign pointing to upward momentum. If LBLOCK can clear the resistance at $0.00002711, it could open doors to a stronger rally, potentially drawing more buyers into the market.
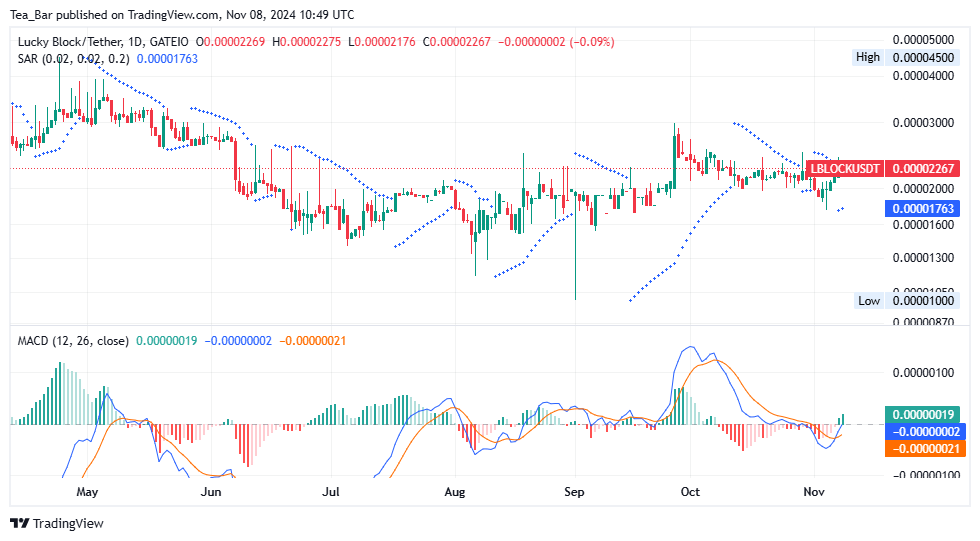
The MACD indicator also provides a bullish signal, as the blue line has crossed above the orange line, suggesting increasing buyer interest. This crossover hints at a steady continuation of the upward trend that has recently developed.
Short-Term Gains Expected on the 4-Hour Chart
In the 4-hour timeframe, LBLOCK’s price is consolidating near $0.00002267, up by around 3.14% in the last session. The Parabolic SAR dots below the current price reflect strong short-term bullish support, while the MACD indicator backs this momentum with another positive crossover. These signals indicate that LBLOCK may be ready for a further push, potentially testing the resistance at $0.00002711.
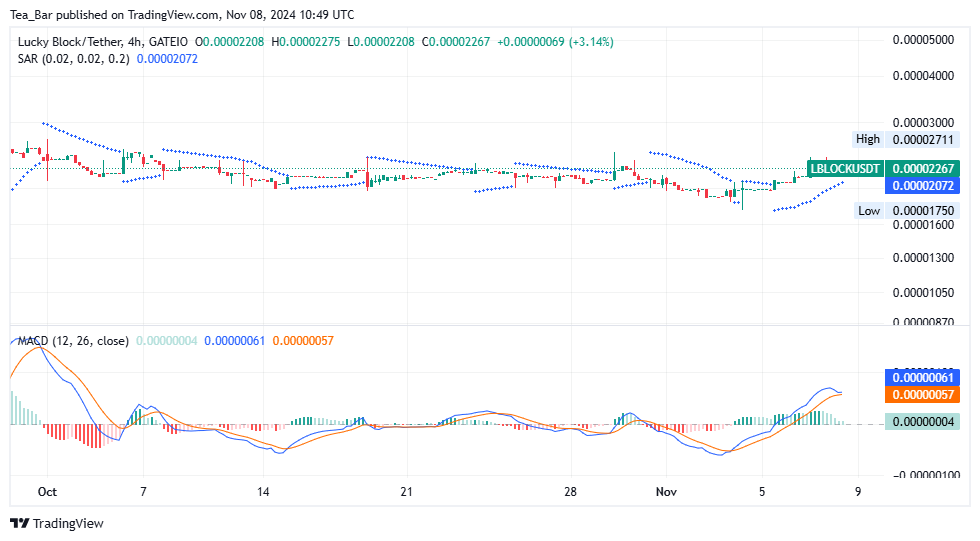
If this bullish sentiment persists, the 4-hour chart’s positive trend could align with the daily outlook, reinforcing the case for a more significant rally in the days ahead.
Looking Forward: LBLOCK’s Path to Growth
With the daily and 4-hour charts both showing bullish indicators, Lucky Block seems well-positioned for continued growth. A breakout above $0.00002711 could serve as a catalyst for a stronger upward move, potentially attracting new interest from both retail and institutional investors.
For traders watching this asset, maintaining an eye on the support around $0.00001750 and the resistance at $0.00002711 will be key. Lucky Block’s steady momentum and positive signals could make it a strong contender for gains in the near future.
You can purchase Lucky Block here. Buy LBLOCK.