Lucky Block (LBLOCK) On the Verge of Breakout: A Deep Dive into Price Movements and Future Projections
Estimated Reading Time: 2 minutes
Don’t invest unless you’re prepared to lose all the money you invest. This is a high-risk investment and you are unlikely to be protected if something goes wrong. Take 2 minutes to learn more

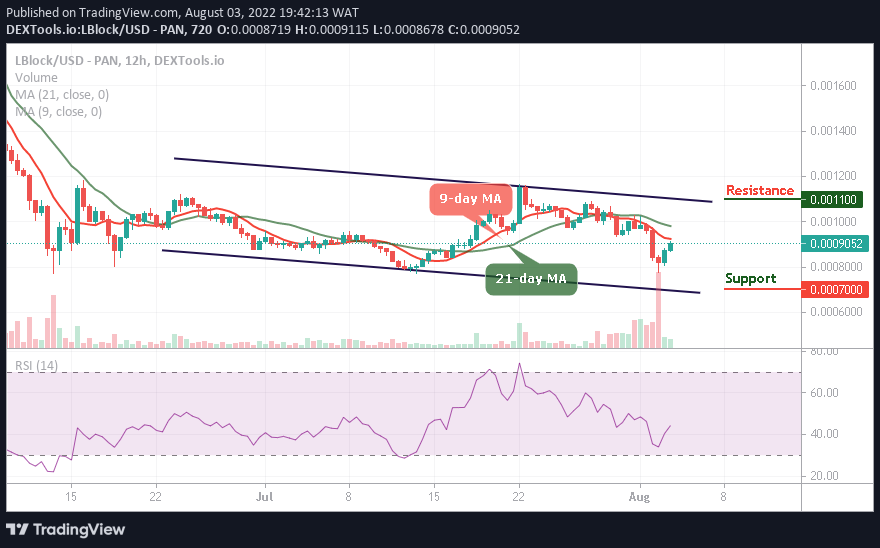
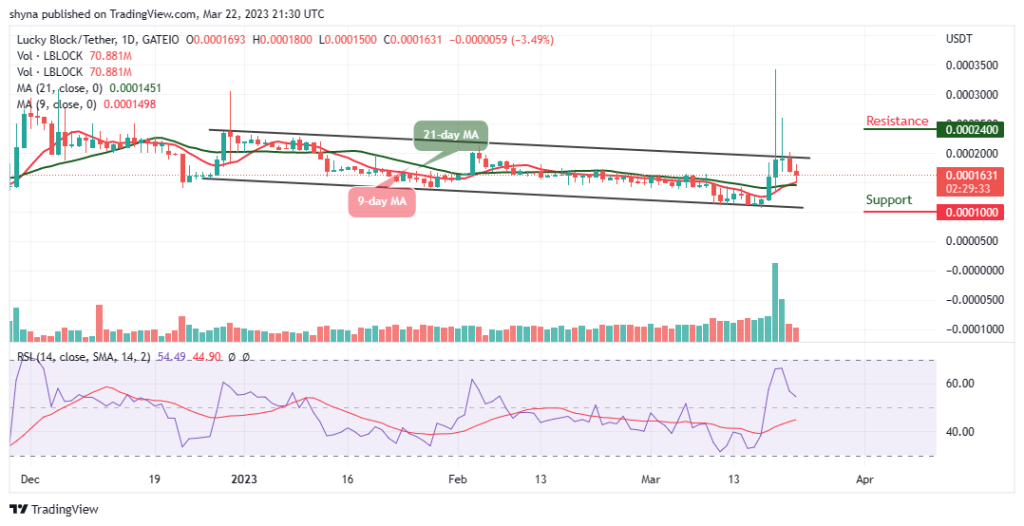
Lucky Block (LBLOCK) has shown resilient price action over the last few months, drawing attention from both traders and enthusiasts. Despite its sideways movement, there are signals that suggest a potential breakout may be on the horizon. Let’s analyze the current trend and indicators on both the daily and 4-hour charts to understand the dynamics driving LBLOCK’s price and what might come next.
Daily Chart Analysis: Signs of Strength in Sideways Action
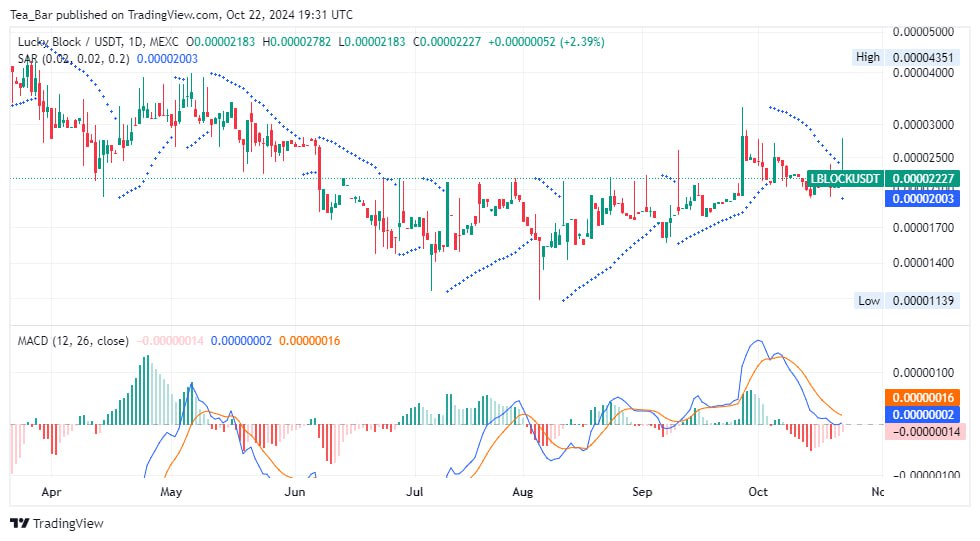
The daily chart shows LBLOCK hovering just above the $0.000022 mark, supported by a positive shift in the Parabolic SAR. This indicator’s dots suggest a reversal from the recent downtrend, hinting at growing momentum. The MACD also supports this, as the histogram is transitioning towards positive territory. This could indicate buyers stepping in, ready to push the price higher in the coming days.
4-Hour Chart: Building Momentum for a Breakout
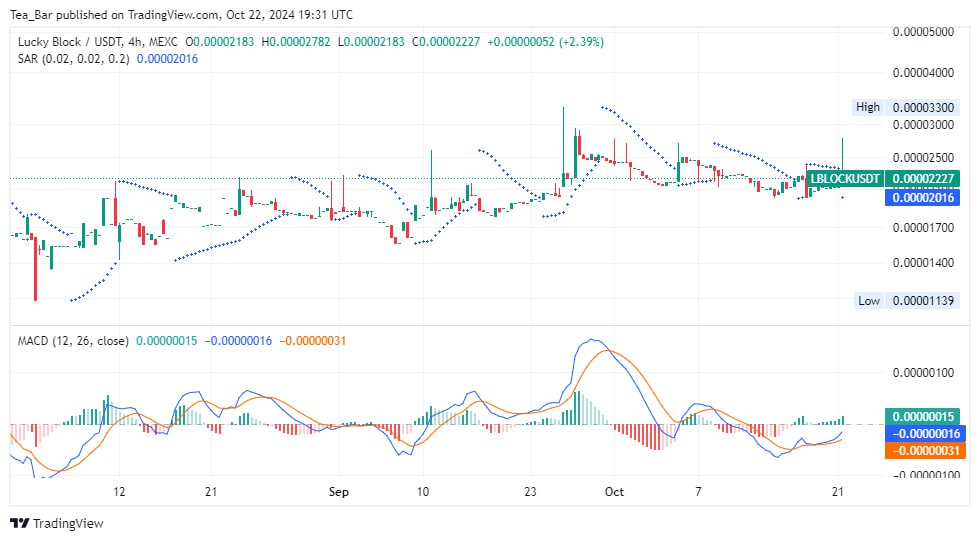
On the 4-hour chart, LBLOCK is consolidating just below $0.00002227, holding steady within a tight range. The Parabolic SAR and MACD both suggest that bullish momentum is building up.With a potential crossover in the MACD line, traders might anticipate a breakout above the $0.000023 level, paving the way for a more sustained upward move. This shorter time frame highlights the patience of the bulls and their potential to dominate the upcoming sessions.
Glimpse into the Future: Can LBLOCK Push Beyond Resistance?
The indicators and price action suggest that LBLOCK is positioning itself for a breakout. If the bullish signals continue to strengthen, we could see the token pushing past its immediate resistance at $0.000025 and targeting the next key level at $0.00003. However, caution remains key, as failure to break above this range could see a short-term consolidation. Nonetheless, the fundamentals and market interest are setting LBLOCK up for an exciting journey ahead.
You can purchase Lucky Block here. Buy LBLOCK.