Lucky Block (LBLOCK) Price Consolidates with Mixed Signals: Analysis
Estimated Reading Time: 2 minutes
Don’t invest unless you’re prepared to lose all the money you invest. This is a high-risk investment and you are unlikely to be protected if something goes wrong. Take 2 minutes to learn more
Lucky Block (LBLOCK) Price Analysis – May 31
Lucky Block (LBLOCK) is currently trading at $0.0000274. Over the past 24 hours, a total of 452,483,711 LBLOCK coins have been exchanged, amounting to a trading volume of $12,384.
The price has decreased by 0.50% during this period. In the last 7 days, LBLOCK has seen a price decline of 2.39%. The price reached a high of $0.0000300 but was unable to maintain this level, indicating a possible resistance point at this price.
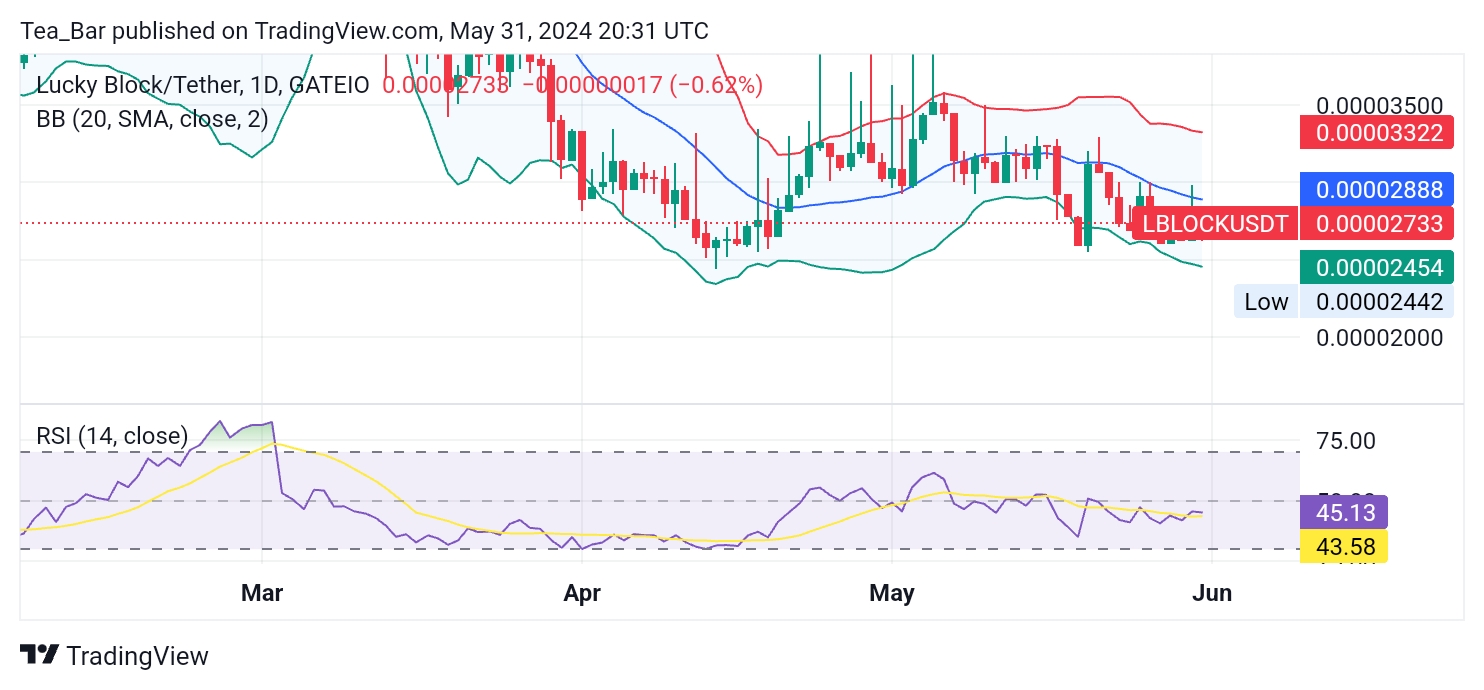
Daily Chart Analysis
The Bollinger Bands for the daily chart indicate that the current price is closer to the middle band. This suggests that while there is potential for the price to rise towards the upper band ($0.0000332), it is also vulnerable to a drop towards the lower band ($0.0000245).
The RSI value of 45 on the daily chart suggests that LBLOCK is currently in the lower end of the neutral zone. This indicates neither overbought nor oversold conditions but suggests a slight bearish bias.
4-Hour Chart Analysis
On the 4-hour chart, the Bollinger Bands show that the current price is near the middle band. This reinforces the potential for price movement in either direction, with immediate support at $0.0000258 and resistance at $0.0000279.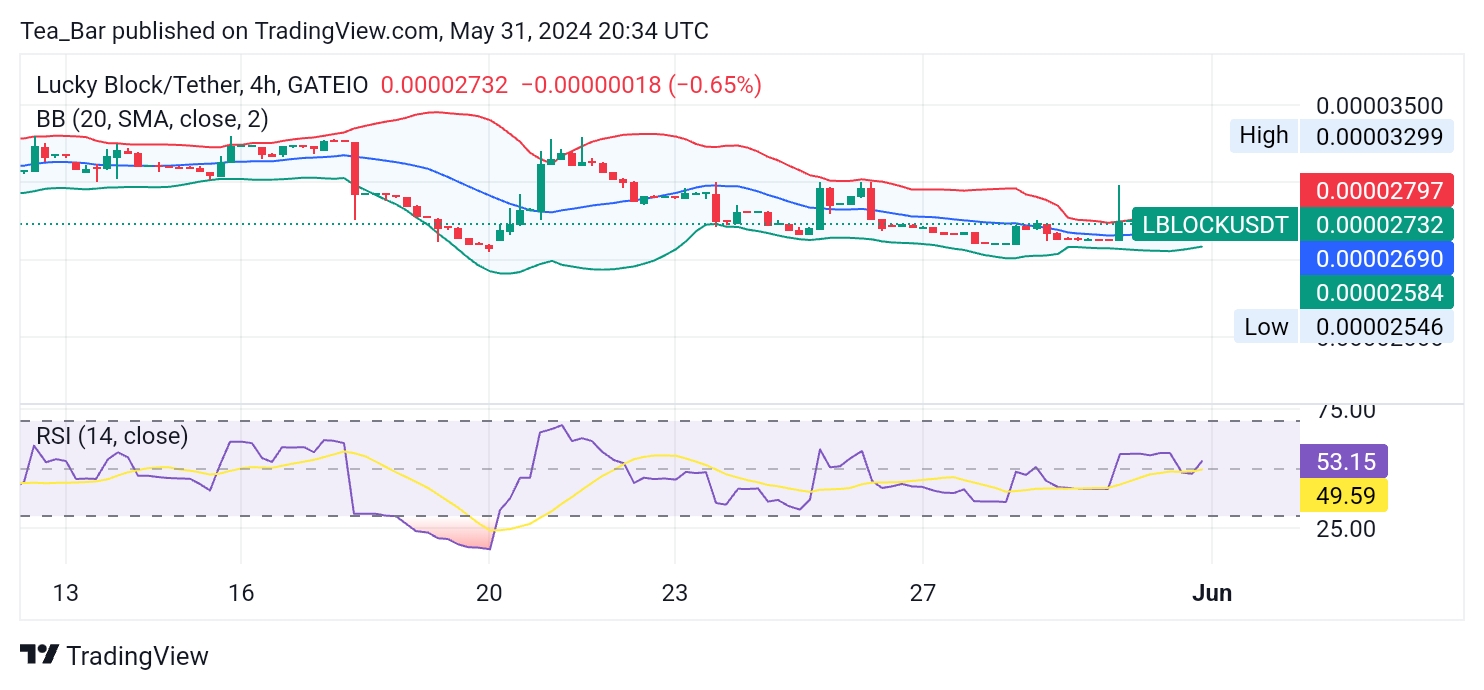
The RSI on the 4-hour chart is at 53, placing it in the neutral zone with a slight upward bias. This suggests a balanced market sentiment with a marginally higher potential for upward movement in the short term.
Conclusion
LBLOCK’s current technical indicators suggest a period of consolidation with potential for volatility. The price is in a neutral to slightly bearish zone on the daily chart, while the 4-hour chart indicates a more balanced sentiment with a slight bullish inclination.
Traders should watch for a break above the $0.0000300 resistance level for a bullish signal or a drop below the $0.0000245 support level for a bearish signal. Monitoring the Bollinger Bands and RSI trends on both daily and 4-hour charts will be crucial for anticipating potential price movements.
You can purchase Lucky Block here. Buy LBLOCK.