Lucky Block (LBLOCK) Faces Downward Trend: Is a Reversal Imminent?
Estimated Reading Time: 3 minutes
Don’t invest unless you’re prepared to lose all the money you invest. This is a high-risk investment and you are unlikely to be protected if something goes wrong. Take 2 minutes to learn more

Lucky Block (LBLOCK) Price Prediction – May 24
As of today, Lucky Block (LBLOCK) is trading at $0.0000280. Over the past 24 hours, the trading volume for LBLOCK has reached $17,841, with 636,268,052 LBLOCK coins being exchanged.
The price has decreased by 4.27% in the last 24 hours, showing a notable downward trend. Over the past week, the price has fallen by 13.16%, and over the past month, it has declined by 15.08%.
However, on a longer-term scale, LBLOCK has shown significant growth, increasing by 52.46% over the past year. It’s important to note that LBLOCK reached its all-time high price of $0.005471 on March 09, 2022.
1-Day Chart Analysis
The 1-day Bollinger Bands indicate that Lucky Block is currently trading near its lower band. The upper Bollinger Band is at $0.00003506, the middle band is at $0.00003064, and the lower band is at $0.00002621.
Trading near the lower band suggests that the coin might be oversold at the moment. Additionally, the Relative Strength Index (RSI) for the 1-day chart stands at 44.
An RSI below 50 generally signifies a bearish trend, but as it approaches the oversold level of 30, it might indicate a potential reversal if buying pressure increases.
4-Hour Chart Analysis
Examining the 4-hour chart provides a similar outlook. The Bollinger Bands for this shorter time frame have the upper band at $0.00003197, the middle band at $0.00002940, and the lower band at $0.00002684. 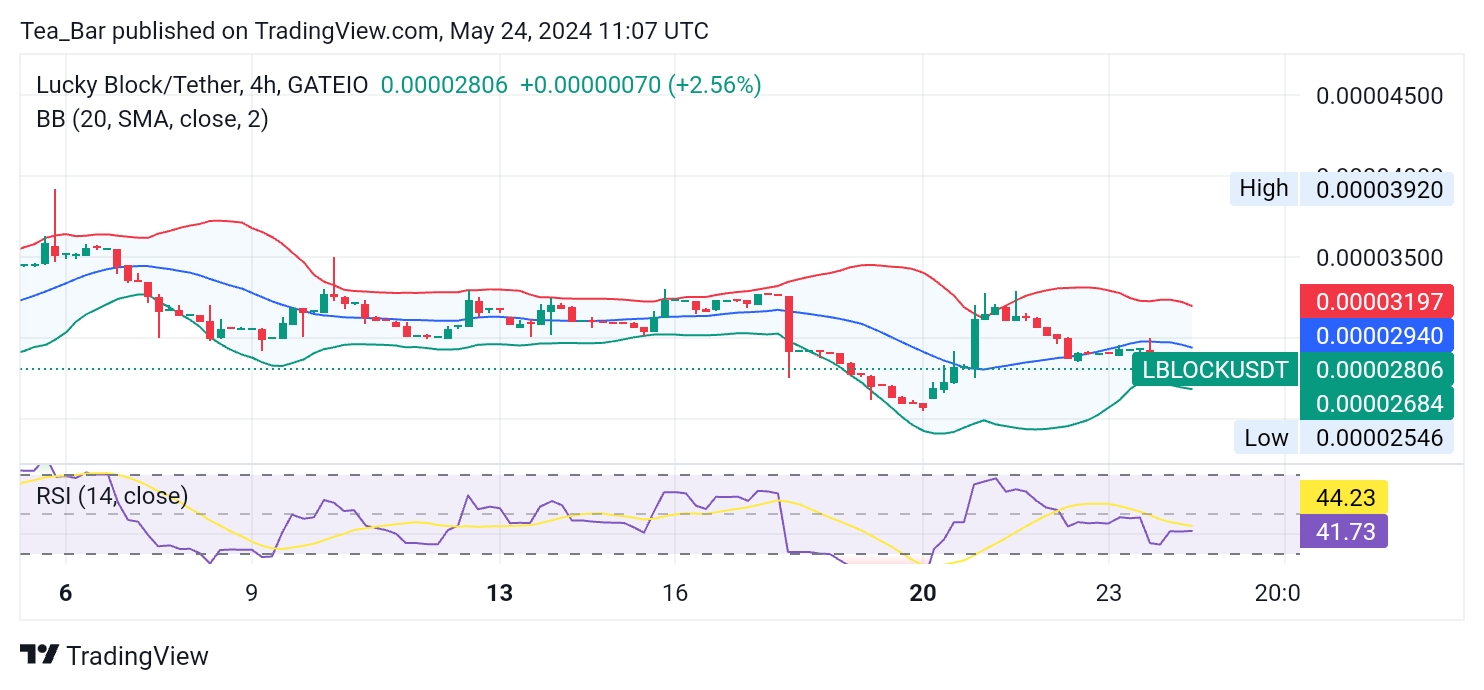
The coin is trading close to the lower Bollinger Band, suggesting potential overselling in the shorter term as well. The RSI on the 4-hour chart is at 41, which is also nearing oversold conditions. This could indicate that LBLOCK is experiencing a temporary dip and might see a price correction soon.
Conclusion
The technical indicators from both the 1-day and 4-hour charts suggest that Lucky Block (LBLOCK) is currently in an oversold state. The proximity to the lower Bollinger Bands and RSI readings nearing oversold territory indicate potential for a price rebound.
Despite the recent declines over the past month and week, the overall yearly performance shows substantial growth, highlighting the coin’s resilience and potential for recovery. Investors may find this an opportune moment to consider LBLOCK, anticipating a possible bounce back from these oversold levels.
You can purchase Lucky Block here. Buy LBLOCK.