POL (Prev. MATIC) Price Prediction: POL/USDT Sees a Negative Correction
Estimated Reading Time: 2 minutes
Don’t invest unless you’re prepared to lose all the money you invest. This is a high-risk investment and you are unlikely to be protected if something goes wrong. Take 2 minutes to learn more

Date: January 17, 2026
Over the previous weeks, the POL (Prev. MATIC) market recorded notable upside movement. However, bullish momentum cooled just below the $0.2000 price level, and since then, the market has been trending downward.
POL/USDT Long-Term Trend — Bearish (Daily Chart)
Key Price Levels
Resistance: $0.1500, $0.1600, $0.1750
Support: $0.1400, $0.1300, $0.1200
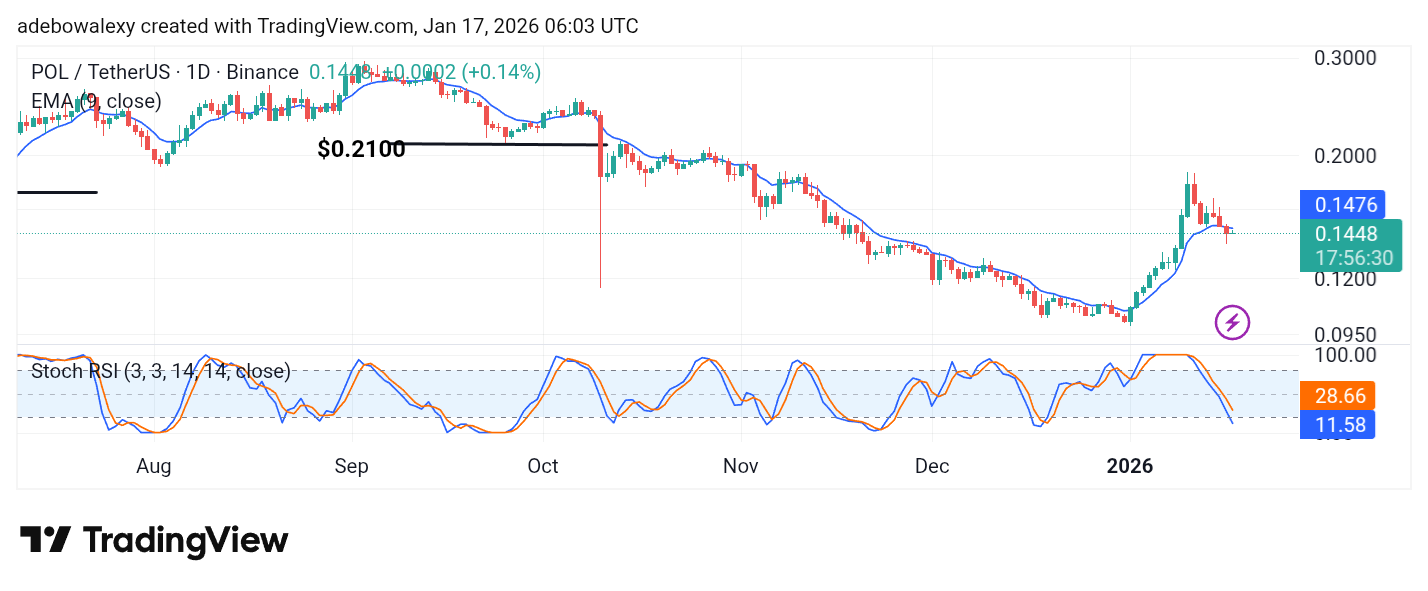
POL (Prev. MATIC) has been sliding downward since the start of the week. The ongoing session has appeared as a green but heavily compressed price candle, which places the coin trading below the 9-day EMA curve. Meanwhile, the Stochastic Relative Strength Index (SRSI) indicator lines are diving rapidly toward the oversold region.
POL/USDT Price Prediction: POL (Prev. MATIC) Bulls Under Pressure (Daily Chart)
While bullish forces previously pushed the POL (Prev. MATIC) market to notable highs, bearish pressure now appears ready to reclaim ground. The most recent price candle is green but formed below the 9-day EMA curve.
Its compressed structure suggests that bearish forces are gaining dominance. At the same time, the SRSI indicator lines are falling sharply toward the oversold region, with the lead line already below the 20 level. Consequently, the market maintains a bearish trajectory on the daily chart.
POL/USDT Price Prediction: POL (Prev. MATIC) Bulls Hit a Wall at the 9-day EMA (4-Hour Chart)
On the 4-hour chart, price action remains closely aligned below the 9-day EMA curve. The last two price candles are green but heavily compressed just beneath the EMA, signaling a consolidation phase.
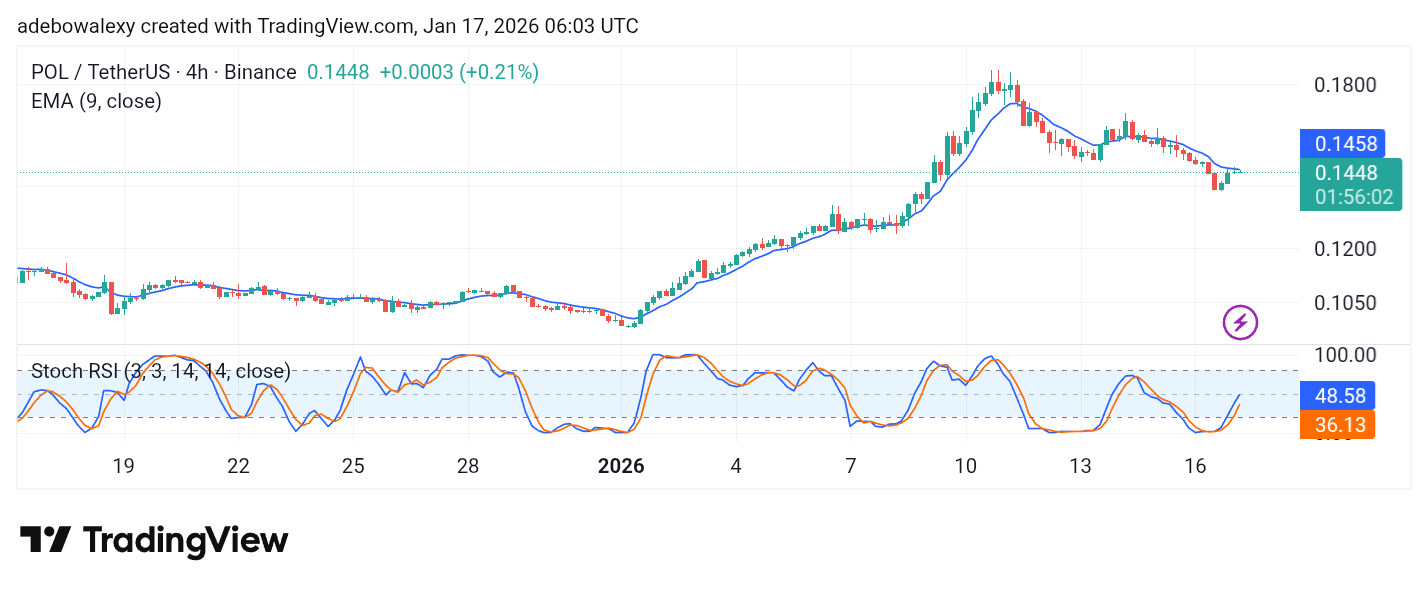
However, the SRSI lines continue to rise, with the lead line holding near the 50 level and pointing upward. Despite this, the 9-day EMA remains a strong resistance barrier.
A decisive break above this level would be required to trigger a stronger upward correction. Therefore, traders may watch for a clear EMA breakout before targeting the $0.1550 level.