Lucky Block (LBLOCK) Price: Stability Before a Move?
Estimated Reading Time: 2 minutes
Don’t invest unless you’re prepared to lose all the money you invest. This is a high-risk investment and you are unlikely to be protected if something goes wrong. Take 2 minutes to learn more
Lucky Block (LBLOCK) Price Analysis – June 6
Lucky Block (LBLOCK) is trading at $0.0000270. Over the past 24 hours, 497,064,826 LBLOCK coins have been exchanged, resulting in a trading volume of $13,424. The price has decreased by 1.18% in the last 24 hours.
Despite this short-term dip, LBLOCK has shown a mixed performance over various timeframes: it has increased by 2.62% over the past 7 days, decreased by 17.50% in the past month, and surged by 101.32% over the past 12 months.
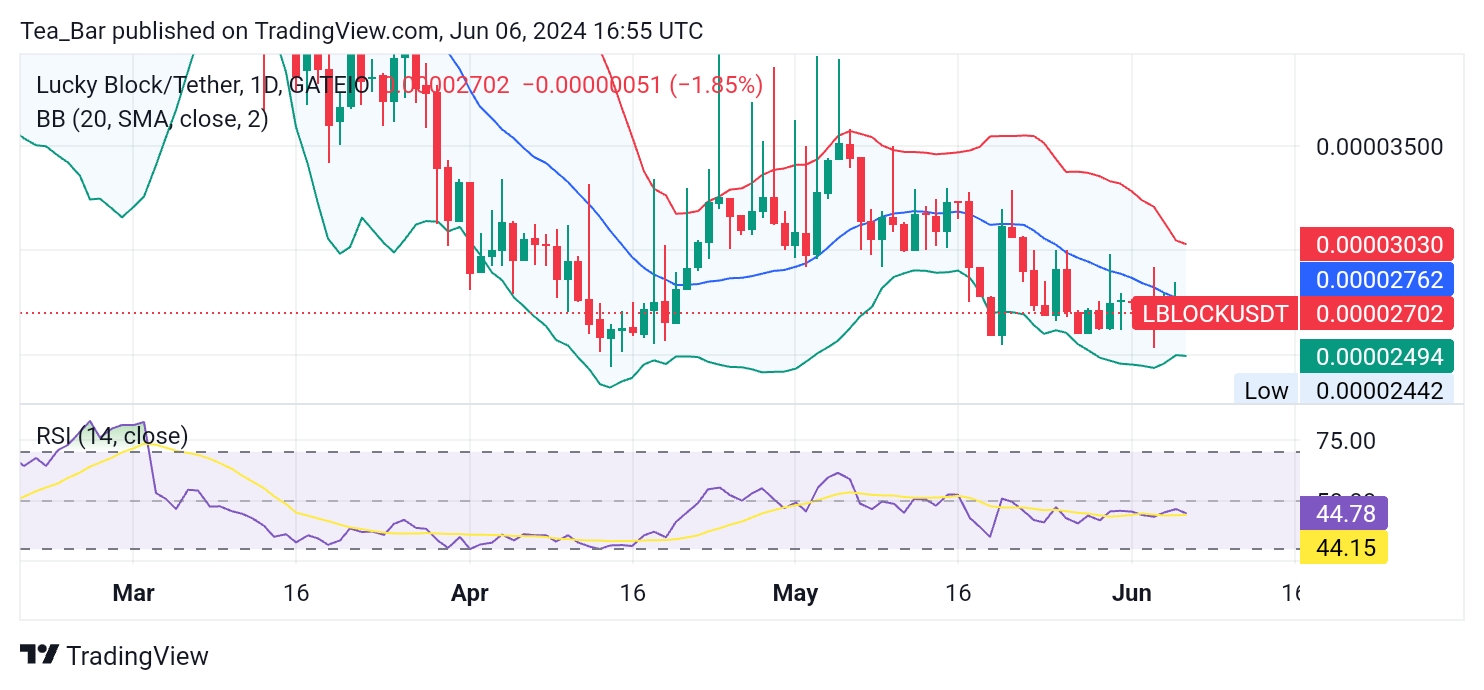
Daily Chart Analysis
Bollinger Bands provide a visualization of price volatility. The price of LBLOCK is currently $0.0000270, which is just below the middle band of $0.0000276. This indicates that the price is relatively neutral but leaning slightly towards the lower end of the band. The proximity to the middle band suggests moderate volatility without extreme price swings.
With an RSI of 44, LBLOCK is in the neutral zone, suggesting that the price is neither overbought nor oversold. This neutral RSI reflects a lack of strong momentum in either direction.
4-Hour Chart Analysis
On the 4-hour chart, LBLOCK’s price is positioned at $0.0000270, which is very close to the middle band of $0.0000271. This indicates a stable condition with price consolidation around this level. The bands suggest that there is no significant upward or downward pressure within this shorter timeframe.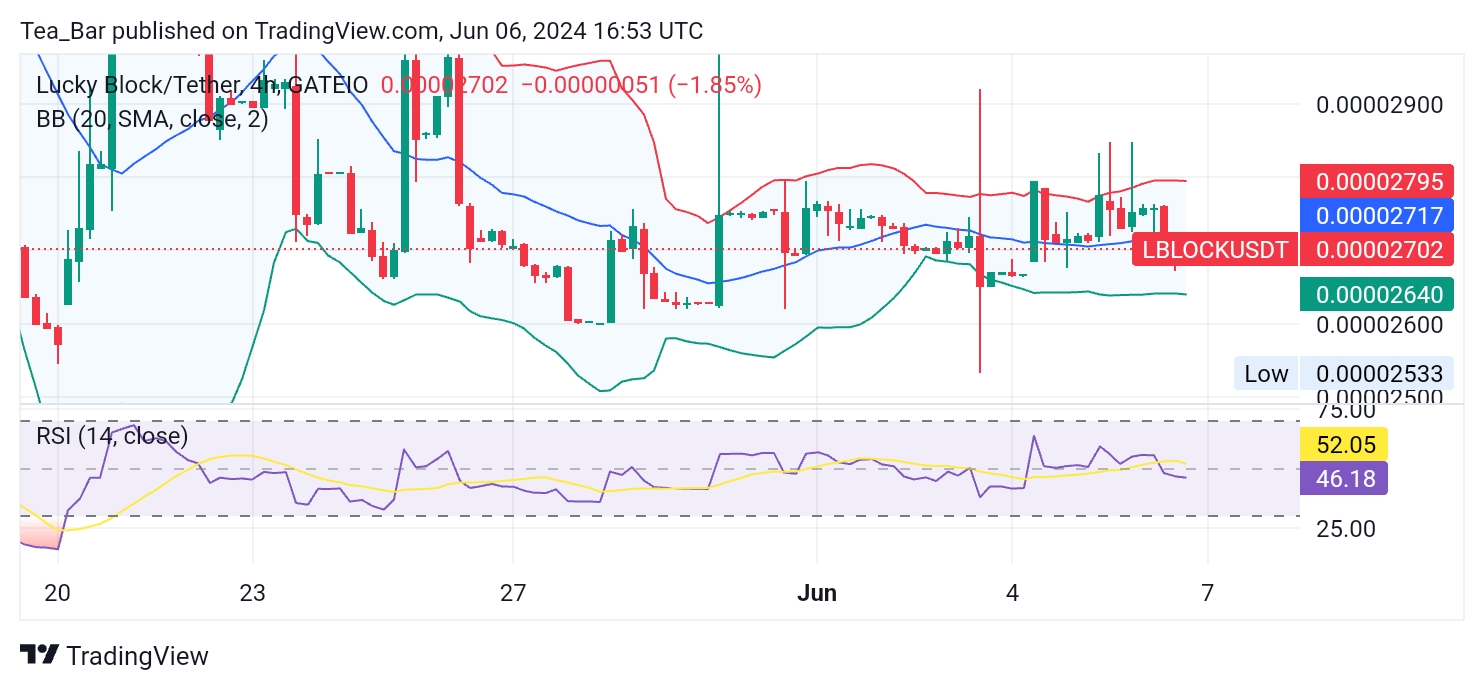
The RSI is at 46, which is similar to the daily RSI and remains in the neutral range. This further suggests a balanced market sentiment without clear bullish or bearish dominance in the shorter term.
Conclusion
The current technical indicators for Lucky Block (LBLOCK) suggest a period of consolidation with no strong directional bias. The price’s position near the middle Bollinger Band on both daily and 4-hour charts indicates stability with moderate volatility. The RSI values on both timeframes are also neutral, further supporting the notion of balanced market conditions.
You can purchase Lucky Block here. Buy LBLOCK.