Lucky Block (LBLOCK) Shows Promising Signs Amid Market Volatility
Estimated Reading Time: 3 minutes
Don’t invest unless you’re prepared to lose all the money you invest. This is a high-risk investment and you are unlikely to be protected if something goes wrong. Take 2 minutes to learn more

Lucky Block (LBLOCK) continues to navigate a volatile market, displaying key signals that suggest potential for upward momentum. Despite its recent dip to $0.00001340, the token is showcasing patterns that may appeal to investors seeking growth opportunities.
LBLOCK Daily Chart Analysis
The daily chart highlights LBLOCK’s price consolidation within the Bollinger Bands, with the current price resting at $0.00001340. This places the token near the lower boundary of the bands, often considered a potential reversal zone. Historical data suggests that such positions could lead to upward price movements.
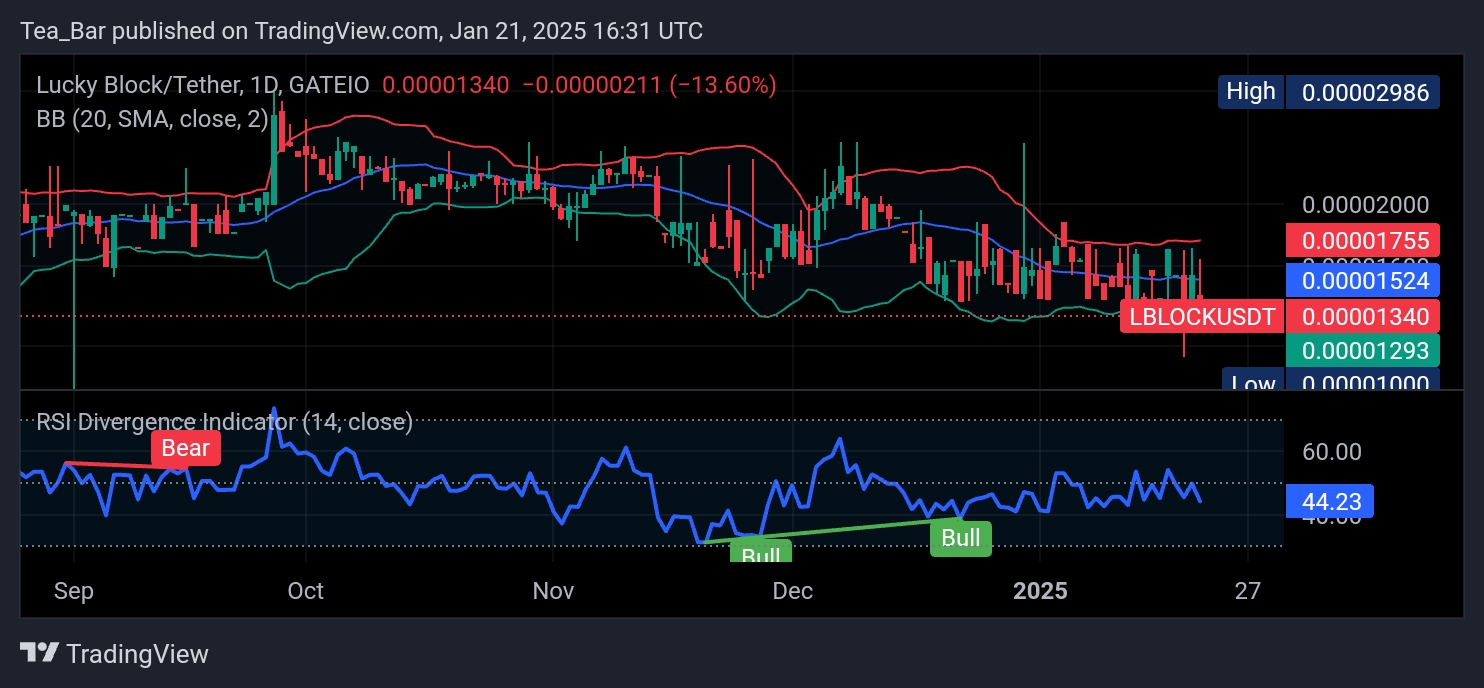
The RSI (Relative Strength Index) on the daily timeframe reads 44.23, indicating a neutral trend and suggesting room for potential growth before hitting overbought conditions. The recent bullish divergence in December also points toward possible positive momentum, with the token poised to reclaim higher levels if buying pressure increases.
4-Hour Chart: Strengthening Support Levels
On the 4-hour chart, LBLOCK trades slightly above its key support level at $0.00001305. This support zone has been tested multiple times, solidifying its strength. A break above $0.00001520, the immediate resistance level, could propel the token toward $0.00001755 or higher.
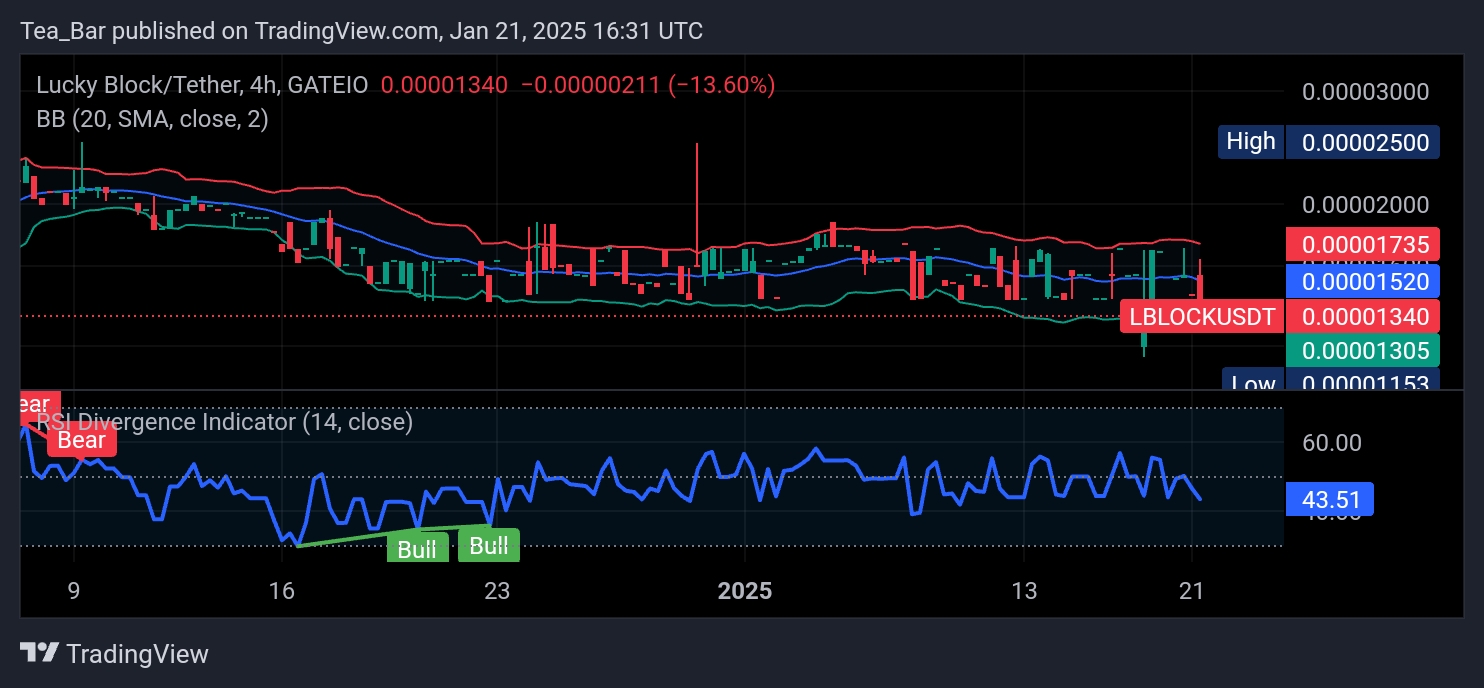
The RSI on this timeframe stands at 43.51, reflecting a balanced scenario where buyers could seize control. Coupled with the Bollinger Bands narrowing, it indicates reduced volatility and the potential for a breakout in either direction. The formation of green “Bull” signals from the RSI Divergence Indicator adds further optimism to LBLOCK’s outlook.
Conclusion: A Token to Watch
While short-term fluctuations may persist, Lucky Block’s technical indicators paint a positive picture for its medium- to long-term prospects. Investors should keep an eye on key resistance levels and monitor market dynamics for a potential trend reversal. LBLOCK’s strategic position near its support levels, combined with historical bullish signals, makes it a noteworthy contender in the current market landscape.
You can purchase Lucky Block here. Buy LBLOCK.