Lucky Block (LBLOCK): Strong Reversal Confirmed – New Uptrend Initiated
Estimated Reading Time: 3 minutes
Don’t invest unless you’re prepared to lose all the money you invest. This is a high-risk investment and you are unlikely to be protected if something goes wrong. Take 2 minutes to learn more

Lucky Block (V2) is demonstrating exceptional strength with a powerful +9.42% surge, breaking from its consolidation pattern and confirming a significant trend reversal. This substantial move reflects growing bullish momentum and positions LBLOCK for potential continued appreciation as technical indicators align favorably across timeframes.
Daily Chart Analysis: Bullish Reversal Pattern Solidifies
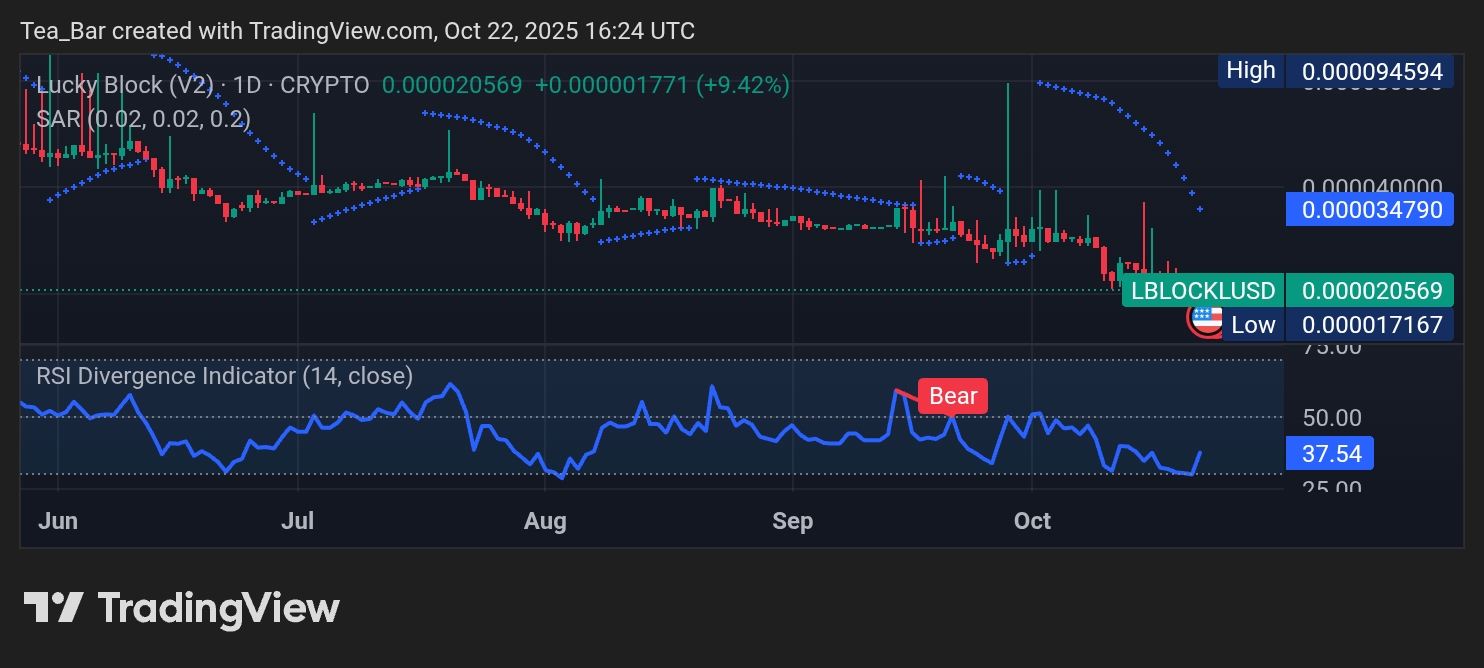
The daily chart showcases a compelling technical picture with the Parabolic SAR indicator confirming a definitive trend reversal. The shift from dots above to below the price action signals the transition from a downtrend to a new emerging uptrend. This bullish confirmation is further supported by the RSI breaking above the 40 level and climbing toward 50, indicating strengthening momentum.
Key resistance levels to monitor are 0.000040000, 0.000078789, and the significant 0.000094594 level. These represent the next targets for the bullish momentum. On the support side, 0.000020569 now serves as immediate foundation, with stronger floors at 0.000017167 and 0.000015000 providing substantial downside protection.
4H Chart Analysis: Momentum Accelerates with Clear Breakout
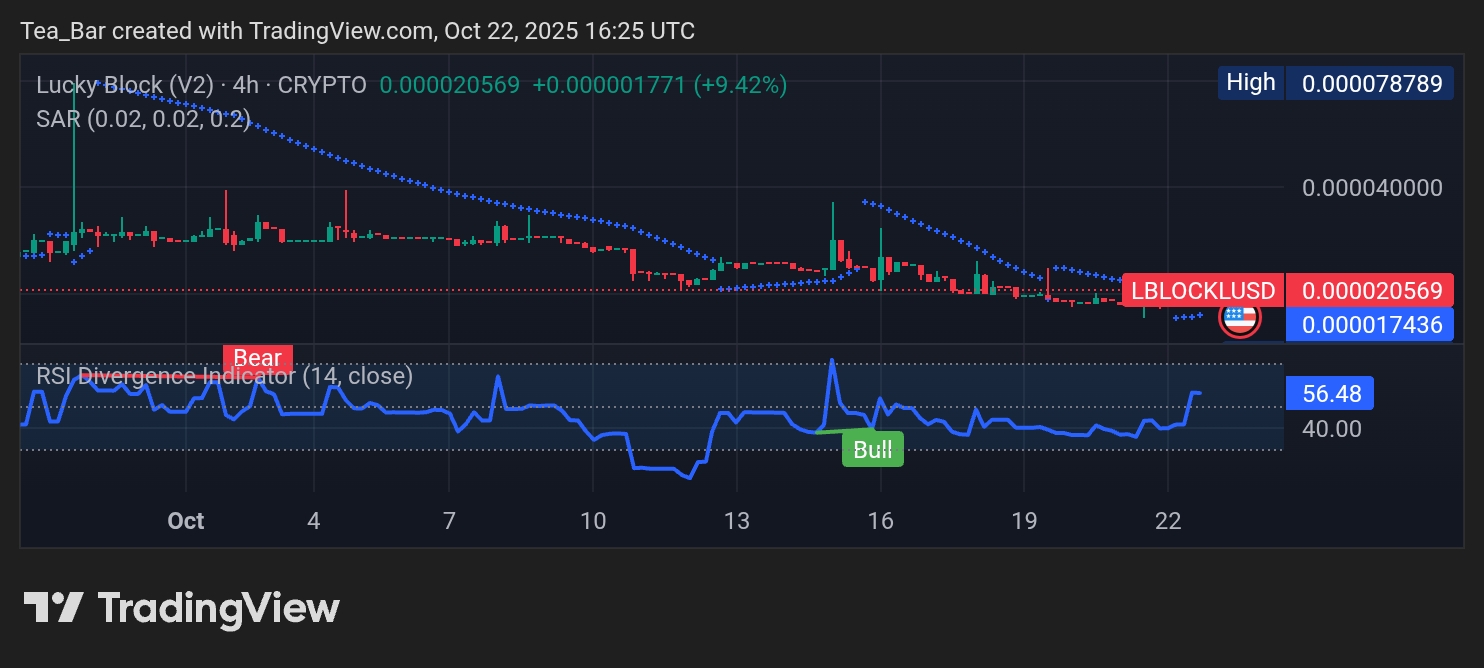
The 4-hour chart reveals the intensity of the current bullish move, with price exploding through immediate resistance levels. The Parabolic SAR has firmly switched to bullish configuration, providing consistent buy signals as each new candle forms. The RSI reading of 56.48 confirms healthy upward momentum without yet reaching overbought territory, suggesting plenty of room for additional gains.
Immediate resistance now sits at 0.000020569, with subsequent targets at 0.000040000 and 0.000078789. The bullish structure finds solid support at 0.000017436, backed by stronger zones at 0.000015000 and the psychological 0.000010000 level.
Conclusion: Bullish Momentum Established with Clear Path Higher
Lucky Block has decisively broken its downward trajectory and established a new bullish trend with strong momentum backing the move. The combination of Parabolic SAR reversal signals, rising RSI readings, and the impressive 9.42% single-day gain creates a compelling technical picture. With clear support levels providing protection and defined resistance targets overhead, LBLOCK presents a structured opportunity for continued upward movement in the sessions ahead.
Invest wisely, and let Lucky Block’s potential work in your favor. You can purchase Lucky Block here. Buy LBLOCK.