Lucky Block (LBLOCK) Technical Analysis: Emerging Optimism in Market Dynamics
Estimated Reading Time: 2 minutes
Don’t invest unless you’re prepared to lose all the money you invest. This is a high-risk investment and you are unlikely to be protected if something goes wrong. Take 2 minutes to learn more

Lucky Block (LBLOCK) Technical Analysis – August 13
Lucky Block has shown an interesting price movement today, with a current price of $0.0000174, marking a 1.28% rise within the last 24 hours (press time). As we dive into the details of both the daily and 4-hour charts, insights emerge that might indicate the future trajectory for LBLOCK.
Daily Chart Analysis of Lucky Block
On the daily chart, the Bollinger Bands for Lucky Block are as follows: the upper band sits at $0.0000215, the middle at $0.0000176, and the lower at $0.0000139. This setup suggests a stable support level at $0.0000139, hinting at a robust base where buying tends to intensify.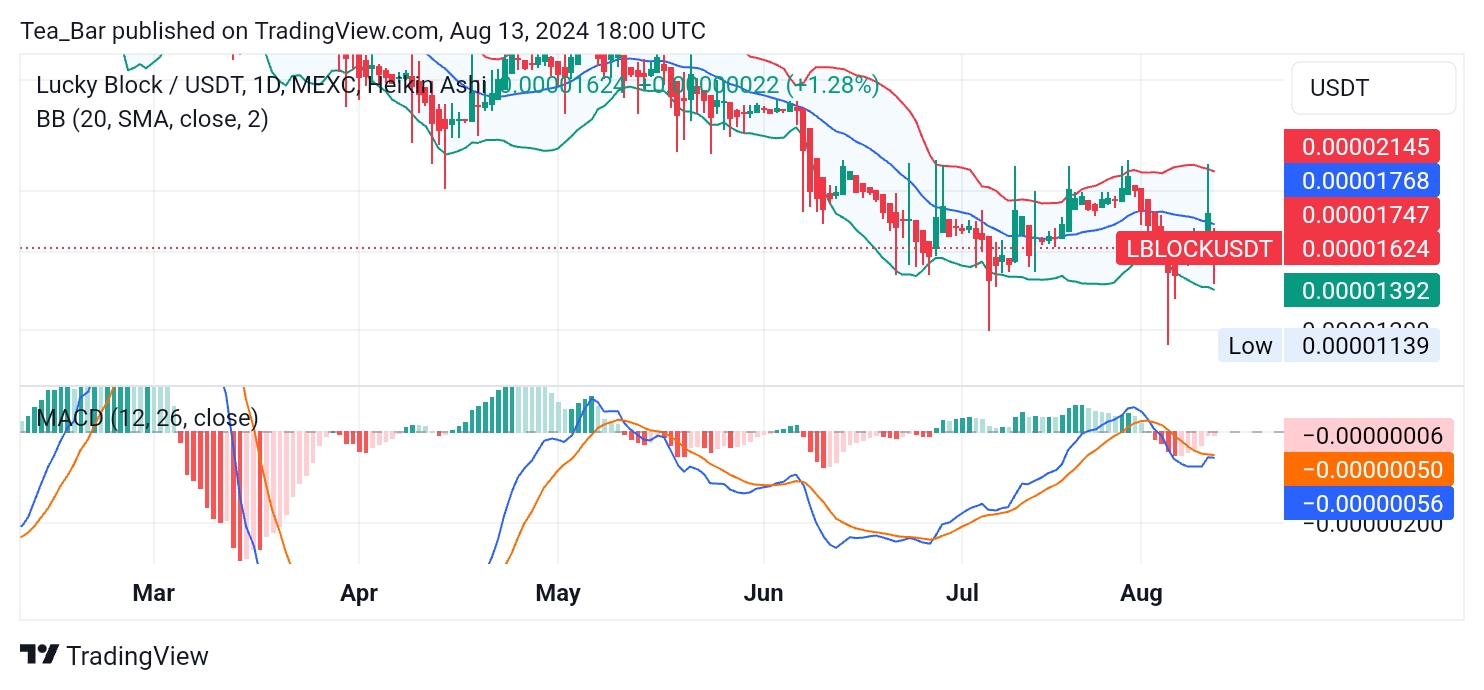
In terms of the Moving Average Convergence Divergence (MACD), the daily chart shows the MACD line almost converging with the signal line but slightly below it, indicating a slight bearish momentum. However, the distance is small, suggesting that a potential bullish crossover could be on the horizon if buying pressure increases.
4-Hour Chart Analysis
The 4-hour chart shows a tighter squeeze in the Bollinger Bands, indicating a very narrow trading range. This could suggest a buildup of pressure that might lead to a breakout.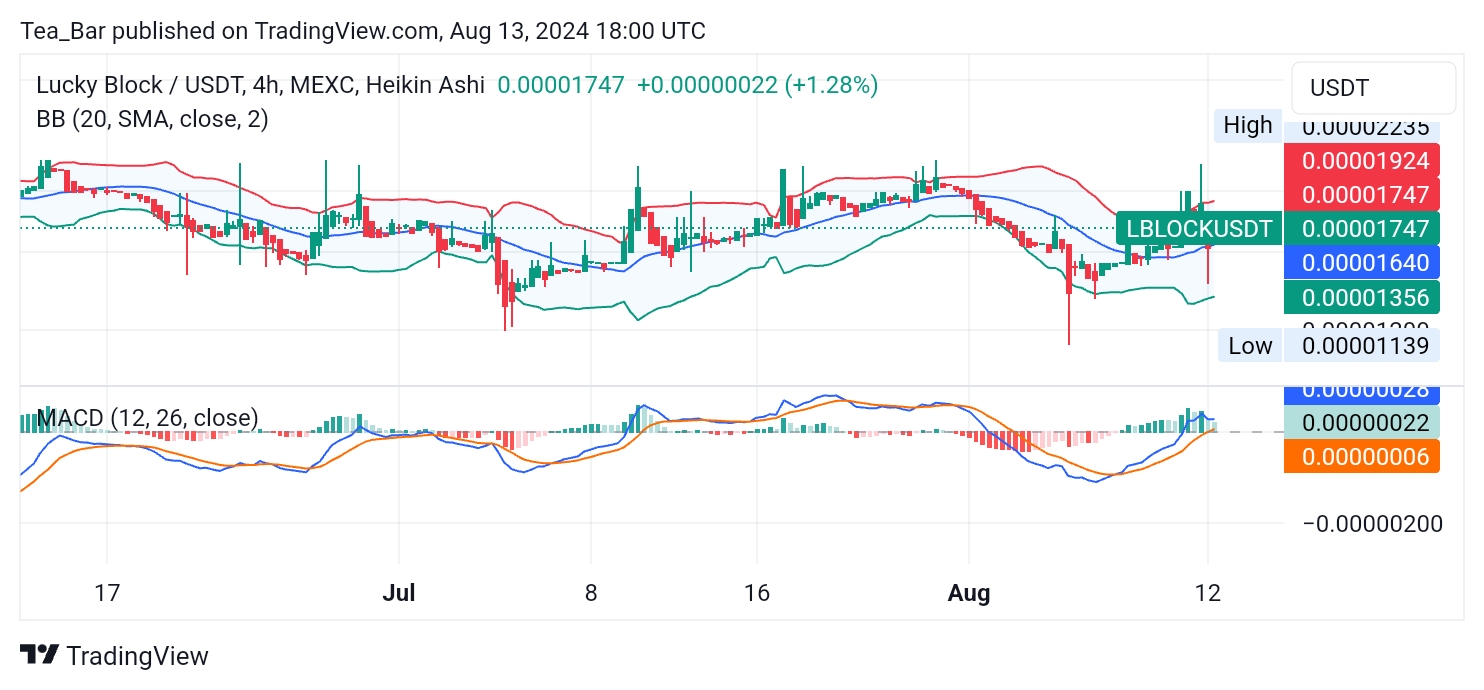
The MACD on this timeframe is positive, as it sits above the signal line, signaling bullish momentum. This is a positive sign and could mean that the short-term trend might lean towards upward movement if the current momentum is maintained or increased.
Conclusion
Lucky Block’s current trading scenario depicts a mix of stability and potential growth. The resistance level to monitor is at $0.0000202, and especially the more psychologically significant $0.0000213. Overcoming these could pave the way for further gains, with the current support established at $0.0000193 providing a fallback in case of price pullbacks.
The MACD indicators, particularly in the 4-hour chart, suggest a bullish sentiment, proposing that LBLOCK could be setting up for an upward trajectory. Investors should keep a close watch on these indicators, as breaking above the resistance could herald a new bullish phase for Lucky Block.
You can purchase Lucky Block here. Buy LBLOCK.