Can Lucky Block Weather the Storm and Reverse the Bearish Trend?
Estimated Reading Time: 3 minutes
Don’t invest unless you’re prepared to lose all the money you invest. This is a high-risk investment and you are unlikely to be protected if something goes wrong. Take 2 minutes to learn more

Lucky Block (LBLOCK) Technical Analysis – August 6
Lucky Block (LBLOCK) is currently trading at 0.0000146 USDT amidst a fluctuating cryptocurrency market. This technical analysis will leverage the daily and 4-hour charts, focusing on the Bollinger Bands, MACD lines, and MACD histograms to provide a comprehensive view of its market position and potential directions.
Daily Chart Analysis of Lucky Block
On the daily chart, Lucky Block (LBLOCK) is positioned near the lower Bollinger Band at 0.0000148 USDT, signaling a potential support zone with the upper band at 0.0000183 USDT and the middle at 0.0000153 USDT. The proximity of the current price to this lower band suggests that buyers might step in to prevent further declines.
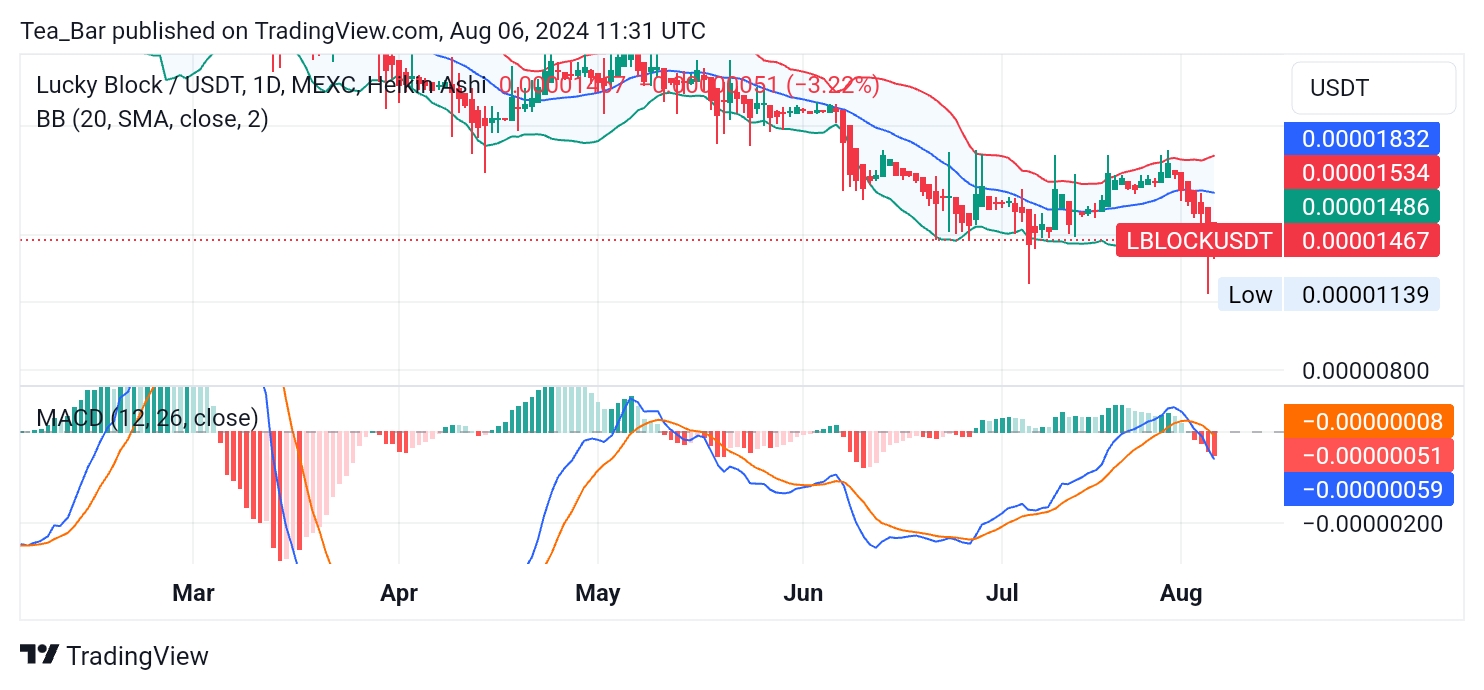
Should the price rebound, the middle band at 0.0000153 USDT could act as the first resistance level, with the upper band at 0.0000183 USDT serving as a major resistance to any bullish breakout attempts.
The MACD histogram, which helps visualize the difference between the MACD line and its signal line, has shown decreasing negative bars, suggesting that the negative momentum is losing strength. This could indicate a potential reversal or at least a slowdown in the downward trend, as the price approaches critical support levels.
4-Hour Chart Analysis
The 4-hour chart shows LBLOCK trading at 0.0000144 USDT, just below the middle Bollinger Band at 0.0000153 USDT. The narrower band range here (upper at 0.0000166 USDT and lower at 0.0000137 USDT) highlights a tighter trading range, which is indicative of consolidation. The recent price movements suggest that 0.0000137 USDT is a crucial support level, helping to prevent further price decreases in the short term as we navigate through the cryptocurrency world
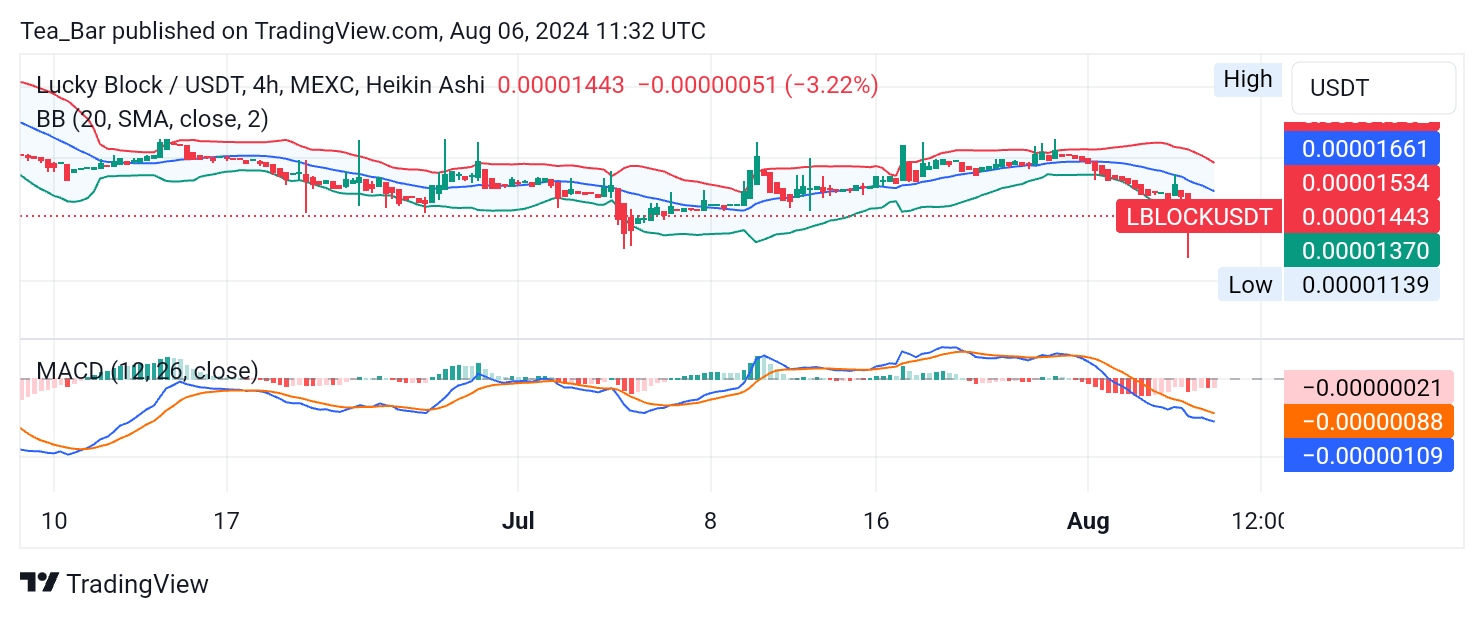
The MACD histogram in this timeframe has been fluctuating but recently presents smaller negative bars, signaling a reduction in bearish momentum. If the price can push above the middle band at 0.0000153 USDT, it could face resistance at 0.0000166 USDT, which would be pivotal for determining whether the price can establish a new upward trajectory.
Conclusion
Analyzing the MACD histograms along with the Bollinger Bands across both daily and 4-hour charts suggests that Lucky Block is nearing a pivotal point. The reducing negative momentum on the histograms, especially near key support levels at 0.0000148 USDT and 0.0000137 USDT, points towards a possible easing of selling pressure.
The critical resistance levels to watch are 0.0000153 USDT and 0.0000183 USDT, as breaking through these could signal a bullish shift. While the immediate outlook remains cautiously optimistic, these technical indicators suggest that LBLOCK may be setting the stage for a rebound or at least maintaining its current levels without further significant drops.
You can purchase Lucky Block here. Buy LBLOCK.