Lucky Block Price Prediction: LBLOCK/USD Will Revisit $0.000050 Level
Estimated Reading Time: 3 minutes
Don’t invest unless you’re prepared to lose all the money you invest. This is a high-risk investment and you are unlikely to be protected if something goes wrong. Take 2 minutes to learn more
Lucky Block Price Prediction – January 27
The Lucky Block price prediction shows that LBLOCK will cross above the 9-day and 21-day moving averages to touch the $0.000050 level.
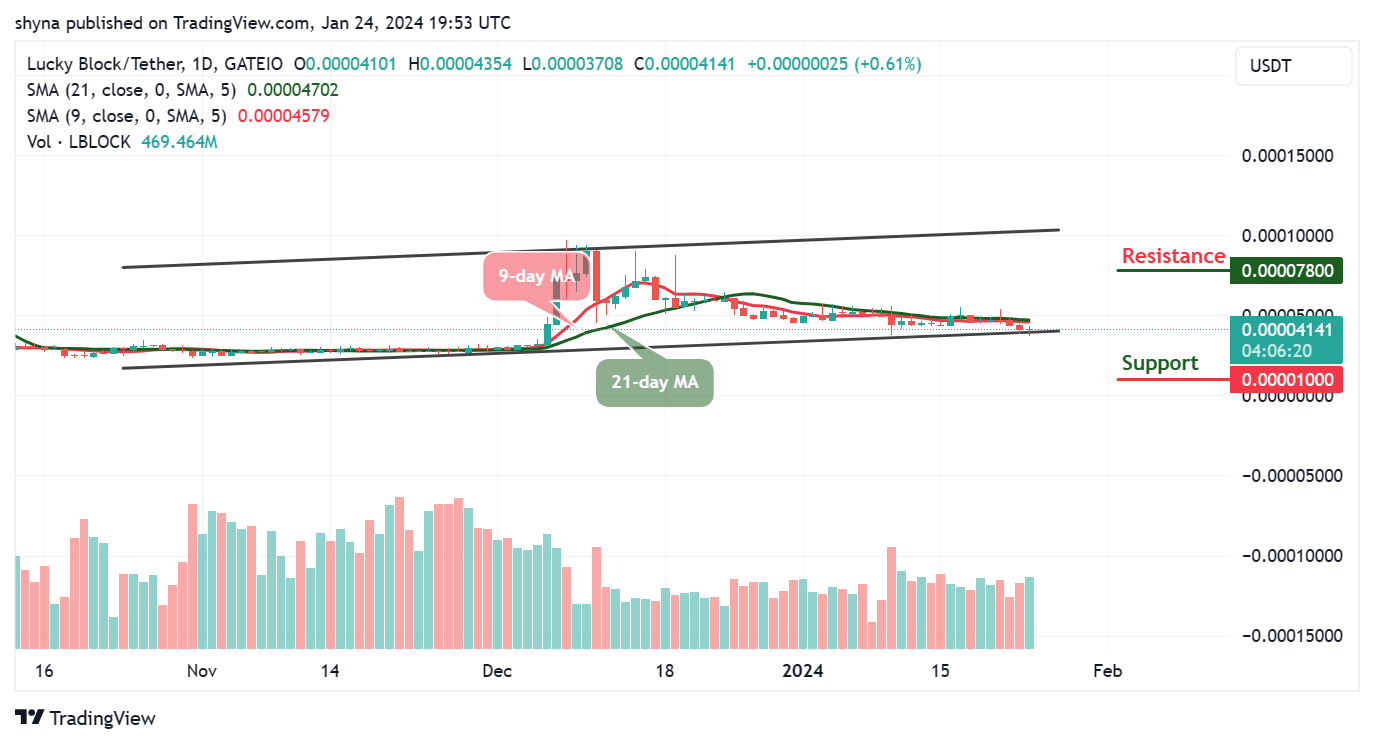
LBLOCK/USD Long-term Trend: Ranging (1D Chart)
Key Levels:
Resistance levels: $0.000078, $0.000080, $0.000082
Support levels: $0.000010, $0.000008, $0.000006
LBLOCK/USD will begin to face the upside as the coin moves to cross above the 9-day and 21-day moving averages. The current movement suggests a bullish movement as buyers are expected to invest more in the coin.
Lucky Block Price Prediction: LBLOCK/USD Prepares to Spike
The Lucky Block price will begin to experience an increasing volume coupled with a bullish regroup as soon as the market follows a positive direction. However, should the coin delay its bullish movement, the bears could step into the market but new buyers are expected to come into the market. Meanwhile, if the selling pressure resumes in the market, it could reach the support levels at $0.000010, $0.000008, and $0.000006.
Meanwhile, the Lucky Block price can spike above the upper boundary of the channel if the 9-day moving average crosses above the 21-day moving average. Moreover, the potential resistance levels could be located at $0.000078, $0.000080, and $0.000082 will come to play.
LBLOCK/USD Medium-term Trend: Ranging (4H Chart)
The Lucky Block price is hovering below the 9-day and 21-day moving averages as the coin prepares for a bullish movement. However, should the price break above the resistance level of $0.000042, the market may experience an upward trend which could touch the resistance level at $0.000047 and above.
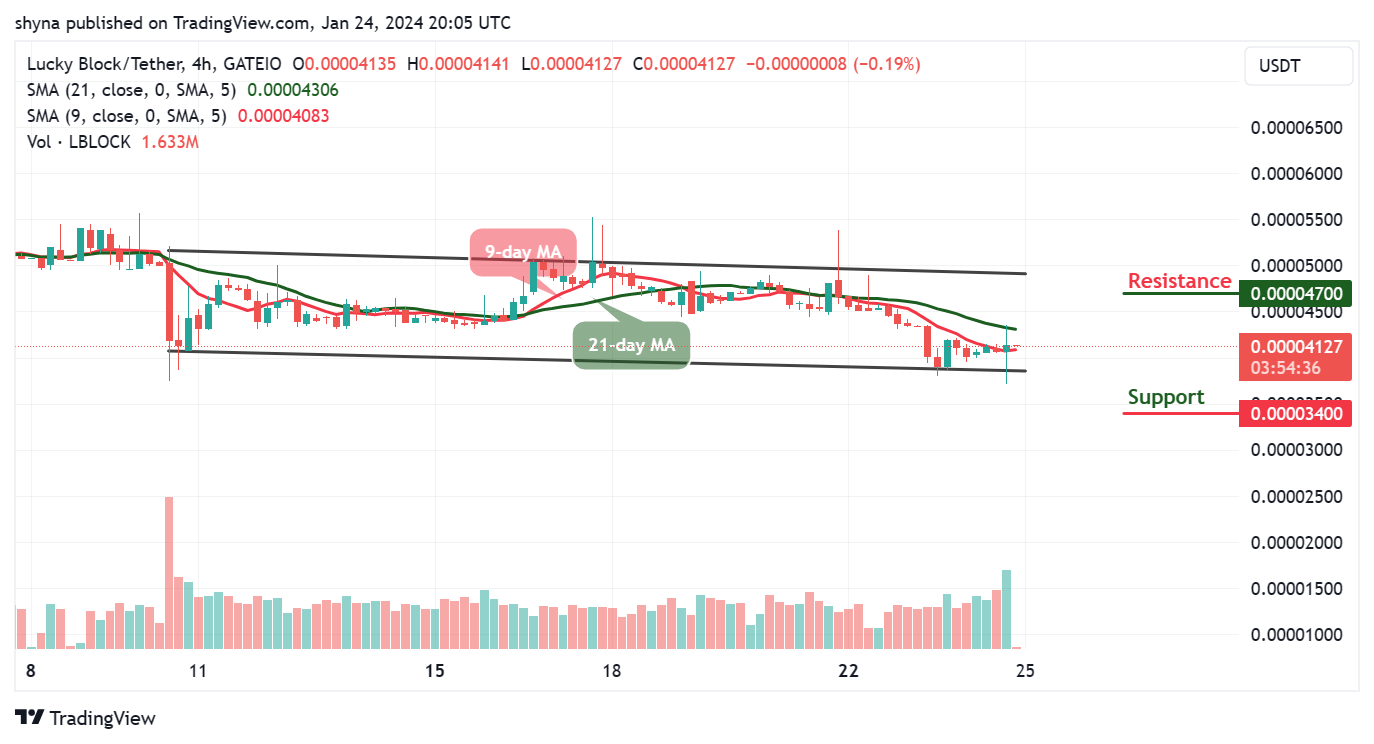
On the contrary, the Lucky Block price could retreat and head toward the lower boundary of the channel, crossing below this barrier could hit the support at $0.000034 and below so that more buyers can come into the market. However, the 9-day moving average is likely to cross above the 21-day moving average, suggesting a bullish movement.
You can purchase Lucky Block here. Buy LBLOCK